
Regulatory Oversight Report for Uranium Mines and Mills in Canada: 2021
On this page
- Plain language summary
- 1 Introduction
-
3 Cigar Lake Operation
- 3.1 Performance
- 3.2 Radiation Protection
- 3.3 Environmental Protection
- 3.4 Conventional Health and Safety
-
3.5 Additional SCAs
- 3.5.1 Management system
- 3.5.2 Human performance management
- 3.5.3 Operating performance
- 3.5.4 Safety analysis
- 3.5.5 Physical design
- 3.5.6 Fitness for service
- 3.5.7 Emergency management and fire protection
- 3.5.8 Waste management
- 3.5.9 Security
- 3.5.10 Safeguards and non-proliferation
- 3.5.11 Packaging and transport
-
4 Mcarthur River Operation
- 4.1 Performance
- 4.2 Radiation Protection
- 4.3 Environmental Protection
- 4.4 Conventional Health and Safety
-
4.5 Additional SCAs
- 4.5.1 Management system
- 4.5.2 Human performance management
- 4.5.3 Operating performance
- 4.5.4 Safety analysis
- 4.5.5 Physical design
- 4.5.6 Fitness for service
- 4.5.7 Emergency management and fire protection
- 4.5.8 Waste management
- 4.5.9 Security
- 4.5.10 Safeguards and non-proliferation
- 4.5.11 Packaging and transport
-
5 Rabbit Lake Operation
- 5.1 Performance
- 5.2 Radiation Protection
- 5.3 Environmental Protection
- 5.4 Conventional Health and Safety
-
5.5 Additional SCAs
- 5.5.1 Management system
- 5.5.2 Human performance management
- 5.5.3 Operating performance
- 5.5.4 Safety analysis
- 5.5.5 Physical design
- 5.5.6 Fitness for service
- 5.5.7 Emergency management and fire protection
- 5.5.8 Waste management
- 5.5.9 Security
- 5.5.10 Safeguards and non-proliferation
- 5.5.11 Packaging and transport
-
6 Key Lake Operation
- 6.1 Performance
- 6.2 Radiation Protection
- 6.3 Environmental Protection
- 6.4 Conventional Health and Safety
-
6.5 Additional SCAs
- 6.5.1 Management system
- 6.5.2 Human performance management
- 6.5.3 Operating performance
- 6.5.4 Safety analysis
- 6.5.5 Physical design
- 6.5.6 Fitness for service
- 6.5.7 Emergency management and fire protection
- 6.5.8 Waste management
- 6.5.9 Security
- 6.5.10 Safeguards and non-proliferation
- 6.5.11 Packaging and transport
-
7 Mcclean Lake Operation
- 7.1 Performance
- 7.2 Radiation Protection
- 7.3 Environmental Protection
- 7.4 Conventional Health and Safety
-
7.5 Additional SCAs
- 7.5.1 Management system
- 7.5.2 Human performance management
- 7.5.3 Operating performance
- 7.5.4 Safety analysis
- 7.5.5 Physical design
- 7.5.6 Fitness for service
- 7.5.7 Emergency management and fire protection
- 7.5.8 Waste management
- 7.5.9 Security
- 7.5.10 Safeguards and non-proliferation
- 7.5.11 Packaging and transport
- References
- Glossary
- A. Facility licensing information
- B. List of inspections
- C. Safety and control area definitions
- D. Safety and control area rating methodology
- E. Safety and control area ratings
- F. Financial guarantees
- G. Worker dose data
- H. Radiological action level exceedances reported to the CNSC
- I. Reportable releases to the environment (spills)
- J. Environmental action level and regulatory limit exceedances reported to the CNSC
- K. Lost-time injuries
- L. Annual releases of radionuclides to the environment
- M. Links to websites
- N. List of indigenous nations and communities
- O. Acronyms
Plain Language Summary
The Regulatory Oversight Report for Uranium Mines and Mills in Canada: 2021 provides information about the work the Canadian Nuclear Safety Commission (CNSC) does to verify the safety and protection of people and the environment around all operating uranium mines and mills in Canada. All operating mines and mills are located in northern Saskatchewan and continued to operate safely in 2021. Monitoring continues to show that the country foods and water surrounding the mines and mills remain safe to eat and drink. There were no releases that could have harmed human health or the environment.
This report provides information on the 5 uranium mines and mills in Saskatchewan for the 2021 reporting period:
- Cigar Lake – uranium mine (operating)
- McArthur River – uranium mine (in care and maintenance)
- Rabbit Lake – uranium mine and mill (in care and maintenance)
- Key Lake – uranium mill (in care and maintenance)
- McClean Lake – uranium mine and mill (operating)
When in a state of care and maintenance, a mine and/or mill is not mining, milling or processing uranium ore, and is not producing uranium concentrate (yellowcake). These facilities still have sufficient staff onsite to complete ongoing maintenance, maintain and operate water treatment systems, and conduct environmental monitoring programs for the protection of workers, the public and the environment.
Each year, CNSC inspectors conduct inspections at uranium mines and mills. The number of inspections and their focus depend on the performance and operating status of the mine or mill.
The CNSC uses a risk-informed approach when planning inspections and, since March 2020, has adapted its inspections to COVID-19 pandemic conditions. In March 2020, all CNSC staff were directed to work from home due to measures taken in response to the COVID-19 pandemic. For this reason, most uranium mine and mill inspections were conducted remotely. CNSC inspectors used a combination of video conferencing, email and document/photograph review to conduct these remote inspections. Onsite inspections were conducted only when there was a clear need and they could be done safely. This practice continued in 2021.
In 2021, CNSC staff performed a total of 18 inspections across the 5 operating mines and mills. As a result of the inspections, CNSC staff found 19 non-compliances. The operators have addressed all the concerns raised during the inspections.
Although the CNSC evaluates operating nuclear facilities across 14 safety and control areas, this report focuses on the following 3 areas:
- Radiation protection: In 2021, the maximum individual radiation dose to a worker at any of the 5 uranium mine and mill facilities was 12.1% of the annual regulatory limit. No workers exceeded their regulatory dose limit.
- Environmental protection: Each mine and mill facility uses water as part of the mining and milling process. All water used in the operation must be treated before being discharged back into the environment. In 2021, all discharged water met the federal or provincial discharge requirements, ensuring that people and the environment near the facilities are safe. Licensees also conduct air and vegetation sampling around their sites. All results of the sampling in 2021 were well below the limits set by the environmental quality guidelines. In addition, CNSC licensees are required to report to the CNSC, and other relevant regulatory authorities, any unauthorized release of hazardous substances or nuclear substances to the environment. In 2021, 15 unauthorized releases were reported. The amounts were within the normal range of releases for uranium mines and mills. All releases were corrected by the mine or mill operators, and no lasting impacts to the environment resulted from these releases.
- Conventional health and safety: Licensees of all mining and milling operations must report any workplace-related lost-time injuries to the CNSC and provincial agencies. In 2021, 5 injuries required reporting. This is consistent with previous years and with injury data from other mining sectors.
As an agent of the Government of Canada, the CNSC recognizes and understands the importance of building relationships with Indigenous peoples in Canada. In 2021, CNSC staff’s efforts continued to support their ongoing commitment to meeting consultation and engagement obligations and building relationships with Indigenous peoples with interests in Canada’s uranium mines and mills. As a result of recommendations from the Commission, CNSC staff continued to meet with Indigenous Nations and communities before the public consultation period to provide information on and seek opportunities for improvement of the regulatory oversight report.
In summary, CNSC staff confirm that:
- workers at each facility were safe and properly protected
- there were no releases that could harm the environment or the health and safety of people
- all water released from the facilities was safe
- airborne radiation was not increased as a result of these facilities’ activities
- fish and plants were safe to eat
- COVID-19 did not affect the CNSC’s ability to verify the safety of uranium mines and mills
1 Introduction
1.1 Background
The Canadian Nuclear Safety Commission (CNSC) regulates Canada’s uranium mines and mills to protect health, safety, security and the environment; to implement Canada’s international commitments on the peaceful use of nuclear energy; and to disseminate objective scientific, technical and regulatory information to the public. This mandate is derived from the Nuclear Safety and Control Act (NSCA) Footnotes section. Supporting CSS is used to lay out the footnotes and hide navigational aidsFootnote 1. Licensees must comply with the NSCA, the regulations made under it, and the licence conditions imposed by the Commission, which include specific licence conditions as well as their licensing basis.
CNSC staff would like to acknowledge that the uranium mine and mill facilities in this report are located on Treaty 10 territory, the Homeland of the Métis, and are within the traditional territories of the Dene, Cree, and the Métis peoples.
Each year, the CNSC produces a regulatory oversight report on the operating performance of Canada’s uranium mine and mill licensees and licensed facilities. This report includes data for the 2021 calendar year for uranium mine and mill sites. Data for historic and decommissioned sites was last presented in the Regulatory Oversight Report for Uranium Mines, Mills, Historic and Decommissioned Sites in Canada: 2020, in CMD 21-M34 Footnote 2, and is presented every 3 years.
This report:
- describes the CNSC’s regulatory efforts; public information and Indigenous and community engagement activities; and Independent Environmental Monitoring Program (IEMP)
- includes information on licensee operations, licence changes, major developments at licensed facilities, and any significant events
- presents the performance rating for each safety and control area (SCA) for uranium mine and mill facilities regulated by the CNSC
- presents performance data on the radiation protection, environmental protection, and conventional health and safety SCAs for each licensed facilityf
This report summarizes CNSC staff’s assessment of the following regulated uranium mine and mill facilities:
- Cigar Lake Operation
- McArthur River Operation
- Rabbit Lake Operation
- Key Lake Operation
- McClean Lake Operation
Throughout the review period, CNSC staff continued to conduct compliance verification activities, including inspections, technical assessments, reviews of reports submitted by licensees, event and incident reviews, and ongoing exchanges of information with the licensees of all uranium mine and mill facilities.
1.2 CNSC regulatory efforts
1.2.1 Licensing
The CNSC regulates each uranium mine and mill under a separate licence. A licence granted by the Commission defines licence terms, licensed activities and licence conditions. Tables summarizing the uranium mine and mill licences can be found in appendix A. Each uranium mine and/or mill licence issued by the Commission is accompanied by a licence conditions handbook (LCH), which contains compliance verification criteria used by CNSC staff to determine compliance with the conditions set out in the licence. All changes made to date during the licence term are also provided in appendix A.
1.2.2 Regulatory developments
CNSC staff continue to modernize the regulatory framework with the CNSC’s series of regulatory documents. CNSC staff have an effective process in place to implement new regulatory documents once they are approved by the Commission. Licensees continue to be in compliance with the regulatory documents or applicable standards identified in their LCHs during the transition process. Licensees are on track to meet all established deadlines. CNSC staff continue to monitor progress through regular licensing meetings.
Table 1.1 lists the updates made since 2019 to the CNSC regulatory documents that apply to the uranium mine and mill licensees, and also indicates the implementation status.
| Regulatory document | Cigar Lake | McArthur River | Rabbit Lake | Key Lake | McClean Lake |
|---|---|---|---|---|---|
| REGDOC-2.2.2, Personnel Training, December 2016 | Implemented as part of 2021 licence renewal | Implementation to be completed October 2022 | Implementation to be completed October 2022 | Implementation to be completed October 2022 | Implemented |
|
REGDOC-2.10.1, Nuclear Emergency Preparedness and Response, February 2016 |
Implemented as part of 2021 licence renewal | To be implemented as part of next LCH update | To be implemented as part of next LCH update | Implemented as part of 2021 LCH update | Implemented |
| REGDOC-2.9.1, Environmental Principles, Assessments and Protection Measures, April 2017 | Implemented as part of 2021 licence renewal | To be implemented as part of next LCH update | To be implemented as part of next LCH update | Implemented as part of 2021 LCH update | Implemented |
| REGDOC-1.6.1, Licence Application Guide: Nuclear Substances and Radiation Devices, May 2017 | Implemented as part of 2021 licence renewal | Implemented | To be implemented as part of next LCH update | Implemented as part of 2021 LCH update | Implemented |
| REGDOC-3.1.2, Reporting Requirements, Volume I: Non-Power Reactor Class I Nuclear Facilities and Uranium Mines and Mills, January 2018 | Implemented as part of 2021 licence renewal | Implemented | To be implemented as part of next LCH update | Implemented as part of 2021 LCH update | Implemented |
|
REGDOC-2.13.1, Safeguards and Nuclear Material Accountancy,
February 2018 |
Implemented as part of 2021 licence renewal | To be implemented as part of next LCH update | To be implemented as part of next LCH update | Implemented as part of 2021 LCH update | Implemented |
| REGDOC-2.5.4, Design of Uranium Mines and Mills: Ventilation Systems, March 2018 | Implemented as part of 2021 licence renewal | Implemented | To be implemented as part of next LCH update | Implemented as part of 2021 LCH update | Implemented |
|
REGDOC-2.1.2, Safety Culture,
April 2018 |
Implementation completed June 2022 | Implementation completed June 2022 | Implementation completed June 2022 | Implementation completed June 2022 | Implemented |
|
REGDOC-3.2.1, Public Information and Disclosure,
May 2018 |
Implemented as part of 2021 licence renewal | To be implemented as part of next LCH update | To be implemented as part of next LCH update | Implemented as part of 2021 LCH update | Implemented |
| REGDOC-2.11.1, Waste Management, Volume III: Assessing the Long-Term Safety of Radioactive Waste Management, May 2018 | Not applicable | Not applicable | Not applicable | Not applicable | Implemented |
|
REGDOC-2.11.1, Waste Management, Volume II: Management of Uranium Mine Waste Rock and Mill Tailings, November 2018 |
Implemented as part of 2021 licence renewal | To be implemented as part of next LCH update | To be implemented as part of next LCH update | Implemented as part of 2021 LCH update | Implemented |
|
REGDOC-2.11.1, Waste Management, Volume I: Management of Radioactive Waste,
January 2021 |
Implementation plan to be submitted September 2022 | Implementation plan to be submitted September 2022 | Implementation plan to be submitted September 2022 | Implementation plan to be submitted September 2022 | Implementation plan to be submitted September 2022 |
|
REGDOC-2.11.2, Decommissioning,
January 2021 |
Implementation plan to be submitted September 2022 | Implementation plan to be submitted September 2022 | Implementation plan to be submitted September 2022 | Implementation plan to be submitted September 2022 | Implementation plan to be submitted September 2022 |
|
REGDOC-3.3.1, Financial Guarantees for Decommissioning of Nuclear Facilities and Termination of Licensed Activities,
January 2021 |
Implementation plan to be submitted September 2022 | Implementation plan to be submitted September 2022 | Implementation plan to be submitted September 2022 | Implementation plan to be submitted September 2022 | Implementation plan to be submitted September 2022 |
|
CSA N292.0:19, General Principles for the Management of Radioactive Waste and Irradiated Fuel,
2019 |
Implementation plan to be submitted September 2022 | Implementation plan to be submitted September 2022 | Implementation plan to be submitted September 2022 | Implementation plan to be submitted September 2022 | Implemented |
|
CSA N294:19, Decommissioning of Facilities Containing Nuclear Substances,
2019 |
Implementation plan to be submitted September 2022 | Implementation plan to be submitted September 2022 | Implementation plan to be submitted September 2022 | Implementation plan to be submitted September 2022 | Implemented |
| CSA N393, Fire Protection for Facilities that Process, Handle or Store Nuclear Substances | Implementation by December 31, 2023 | Implementation by December 31, 2023 | Implementation by December 31, 2023 | Implementation by December 31, 2023 | Implemented |
1.2.3 Compliance
The CNSC determines licensee compliance through verification, enforcement and reporting activities. CNSC staff develop compliance plans for each facility commensurate with their associated risk and implement these plans by conducting regulatory activities such as onsite and remote inspections and technical assessments of licensee programs, processes and reports. Changes to compliance plans are made on an ongoing basis in response to events, facility modifications and changes in licensee performance.
On March 15, 2020, the CNSC activated the Business Continuity Plan in response to the COVID-19 pandemic. Effective March 16, 2020, all CNSC staff were directed to work from home. CNSC staff continued to conduct oversight activities during the ongoing COVID-19 pandemic to assess the protection of the environment, and the health and safety of workers and the public. Wherever possible, in 2021, inspections of uranium mines and mills were conducted remotely. In all, 95% of inspections were conducted remotely, and 1 inspection was deferred until the onsite inspection could occur safely. Compliance activities for uranium mine and mill facilities continued remotely, and onsite verification activities resumed on a risk-informed basis in observance of relevant COVID-19 health protocols.
Table 1.2 presents data on CNSC staff inspections conducted at uranium mines and mills since the 2017 calendar year. Instances of non-compliance noted during these inspections were communicated to the licensees in detailed inspection reports and recorded in the CNSC Regulatory Information Bank in order to ensure that corrective actions were tracked to completion. Examples of non-compliances include failure to wear radiation monitoring equipment, non-compliance with the Footnote 3, failure to follow procedures, identification of additional personnel training needs, and incorrect or incomplete labelling or signage.
| 2017 | 2018 | 2019 | 2020 | 2021 | |
|---|---|---|---|---|---|
| Number of inspections | 30 | 26 | 20 | 17 | 18 |
| Instances of non-compliance | 23 | 31 | 23 | 11 | 19 |
All instances of non-compliance identified were of low safety significance. Safety significance is determined based on comparison to criteria developed and used in the CNSC Regulatory Information Bank. Examples of the criteria are included in the appendices to this report, in tables H-2, I-2, J-2 and K-2. Additional details on the inspections covered in this reporting period can be found in appendix B. CNSC staff assessed the licensees’ corrective actions taken in response to the identified instances of non-compliance and verified that these actions were appropriate and acceptable. All instances of non-compliance were addressed appropriately by the licensees to meet all regulatory requirements and have been closed by CNSC staff.
Other regulatory bodies that conduct inspections at the facilities include the Saskatchewan Ministry of Environment, the Saskatchewan Ministry of Labour Relations and Workplace Safety, and Environment and Climate Change Canada (ECCC).
These regulatory bodies focus primarily on the areas of conventional health and safety and environmental protection. CNSC staff take into account the findings from these regulatory bodies when assessing licensees’ performance. When logistically reasonable, joint inspections are conducted with other federal or provincial regulatory agencies. No joint inspections occurred in 2021.
1.2.4 Safety and control area framework
SCAs are the technical topics that CNSC staff use across all regulated facilities and activities to assess, evaluate, review, verify and report on regulatory requirements and performance. The CNSC’s SCA framework, which staff use to evaluate licensee safety performance, includes 14 SCAs. Each SCA is subdivided into specific areas that define its key components. Appendix C provides definitions of these SCAs and their specific areas.
CNSC staff use the following 3 ratings, defined in appendix D, to grade licensee performance in each applicable SCA:
- satisfactory (SA)
- below expectations (BE)
- unacceptable (UA)
This report contains CNSC staff’s performance ratings for all applicable SCAs, with a focus on 3 SCAs that cover many of the key performance indicators for mining and milling operations: radiation protection, environmental protection, and conventional health and safety.
For 2021, all SCA performance ratings for uranium mines and mills were rated satisfactory.
CNSC staff concluded, based on the results of regulatory oversight activities, that uranium mine and mill facilities met the following requirements:
-
Radiation protection measures were effective, and radiation doses received by workers remained consistent with the as low as reasonably achievable (ALARA) principle, which considers social and economic factors; as a result:
- no worker doses exceeded regulatory effective dose limits
- where action level exceedances occurred, they were reported and investigated to determine the causes, and corrective actions were identified by the licensee and verified by CNSC staff
-
Environmental protection programs were effective, and as a result, emissions and effluents remained well below regulatory limits:
- where action level exceedances occurred, they were reported and investigated, and corrective measures were implemented by the licensee and verified by CNSC staff
-
Conventional health and safety programs continued to protect workers:
- where a lost-time injury (LTI) was reported, corrective measures were implemented by the licensee and verified by CNSC staff
- Appendix E provides the SCA performance ratings for uranium mines and mills for the previous 5 years, from 2017 to 2021.
1.2.5 Independent Environmental Monitoring Program
The CNSC requires that each nuclear facility licensee develop, implement and maintain an environmental monitoring program to demonstrate that the public and the environment are protected from any releases to the environment related to the facility’s nuclear activities. CNSC staff evaluate and assess the results of these monitoring programs to determine compliance with the applicable requirements and limits, as set out in the regulations that govern Canada’s nuclear industry.
The CNSC implemented the IEMP to build Indigenous and public trust in the CNSC’s regulation of the nuclear industry. The IEMP is an independent, technical environmental sampling program that uses CNSC resources effectively and efficiently. The IEMP is a regulatory tool that complements and informs the CNSC’s ongoing compliance verification program. The IEMP does not rely on licensees to provide samples. CNSC staff or independent contractors obtain samples from publicly accessible areas around nuclear facilities, then measure and report the amounts of radiological and hazardous substances present in those samples to the Commission, Indigenous Nations and communities, and the public.
In 2021, CNSC staff conducted independent environmental monitoring at Key Lake and McArthur River. The 2021 IEMP results, which are posted on the CNSC’s IEMP web page, demonstrate that persons and the environment around these facilities are protected, and that no adverse environmental or health effects are expected as a result of these facilities’ operations. In addition, these results are consistent with the results submitted by the licensees. The IEMP results add to the body of evidence and support CNSC staff’s assessment that the public and the environment in the vicinity of the uranium mines and mills are protected and that the licensees’ environmental protection programs are effective.
1.3 Public information and Indigenous engagement
The CNSC’s regulatory document REGDOC-3.2.1, Public Information and Disclosure Footnote 4, sets out the requirements for public information and disclosure. The primary goal of the program is to ensure that information related to the health, safety and security of persons and the protection of the environment, and other issues associated with the lifecycle of nuclear facilities, is shared with the public in a format relevant to the audience. The program includes a commitment and protocol for ongoing, timely dissemination of information related to the licensed facility. As the operating mine and mill sites are located in northern Saskatchewan, an area with a predominantly Indigenous population, this dissemination of information frequently includes and is accompanied by Indigenous engagement activities. As an agent of the Government of Canada, the CNSC recognizes and understands the importance of consulting and building relationships with Indigenous peoples in Canada. CNSC staff are committed to building long-term relationships with Indigenous Nations who express an interest in CNSC-regulated facilities within their traditional and/or treaty territories. By pursuing informative and collaborative ongoing interactions, the CNSC's goal is to build partnerships and trust.
The CNSC's Indigenous engagement practices are consistent with the principles of upholding the honour of the Crown and reconciliation. These practices include information sharing and funding support (through the CNSC's Participant Funding Program, or PFP) to assist Indigenous peoples in meaningfully participating in Commission proceedings and ongoing regulatory activities.
A list of Indigenous Nations and communities whose traditional and/or treaty territories are in proximity to operating uranium mine and mill sites is available in appendix N.
1.3.1 Public information and disclosure programs
In 2021, licensees faced many continuing challenges due to the COVID-19 pandemic and had to adapt their public information programs accordingly. This included moving away from traditional in-person meetings, tours and events, and offering webinars and increased digital communications whenever possible. While many of the uranium mines and mills were in care and maintenance during 2021, licensees were still required to maintain their public information and disclosure program and disclose important information to the public.
Upon review, CNSC staff determined that the public information and disclosure programs implemented by Cameco Corporation (Cameco) and Orano Canada Inc. (Orano) complied with REGDOC-3.2.1 Footnote 4, and that both licensees provided regular information and engagement opportunities on the status of their facilities to key audiences by adapting to a virtual environment. This included:
- holding and attending virtual meetings to discuss the effect of COVID-19 on operations, licence renewals and preliminary decommissioning plans
- providing website updates on the pandemic and other items of interest
- increasing their social media presence
Licensees continue to implement their respective public information and disclosure programs to ensure that their audiences are receiving the appropriate information at the right time in a way that is meaningful to the community. In 2021, both licensees provided pertinent information related to health, safety and the environment through methods adapted to the pandemic reality.
1.3.2 Indigenous consultation and engagement
CNSC staff worked with Indigenous groups and organizations in northern Saskatchewan to identify opportunities for formalized and regular engagement throughout the lifecycle of these sites, including meetings and facilitated workshops. There were no Northern Saskatchewan Environmental Quality Committee meetings conducted in 2021 because of the ongoing COVID-19 pandemic. The majority of engagement and consultation with Indigenous groups in northern Saskatchewan in 2021 occurred via remote means due to public health recommendations related to COVID-19.
As a result of recommendations from the Commission, CNSC staff continue to hold an annual meeting with Indigenous groups and communities in northern Saskatchewan before the public consultation period to provide updated information on, and seek opportunities for improvement of, the regulatory oversight report, such as the plain language summary that is now included. Indigenous groups with an interest in Canada’s uranium mines and mills are also provided a copy of the regulatory oversight report for review each year.
In October 2021, CNSC staff hosted a virtual meeting with Indigenous Nations and communities with interests in the uranium mine and mill sites in northern Saskatchewan to discuss areas, sites and projects, including the following:
- Beaverlodge Project (Cameco)
- McArthur River Operation (Cameco)
- Cigar Lake Operation (Cameco)
- Rabbit Lake Operation (Cameco)
- Key Lake Operation (Cameco)
- Cluff Lake Project (Orano)
- McClean Lake Operation (Orano)
- Gunnar legacy uranium mine (Saskatchewan Research Council, or SRC)
- former Lorado mill site (SRC)
In addition, CNSC staff carried out a number of engagement activities with Indigenous groups in northern Saskatchewan/Alberta, the majority of which were conducted virtually:
- held meetings directly with a number of Indigenous Nations and communities on Cameco’s Cigar Lake Operation licence renewal and provided updates
- held meetings directly with a number of Indigenous Nations and communities on Orano’s McClean Lake Operation licence amendment and provided updates
- provided all potentially interested Indigenous Nations and communities with notice of the PFP opportunities for the annual uranium mines and mills regulatory oversight report, Cameco’s Cigar Lake Operation licence renewal application, Orano’s McClean Lake Operation licence amendment application, and Cameco’s Beaverlodge licence amendment application
- provided interested Indigenous Nations and communities with notice of the PFP opportunity to comment on and review Denison Mines’ Wheeler River Project draft environmental assessment
- provided general updates on the IEMP to verify that the public, Indigenous Nations and communities, and the environment around nuclear facilities are safe
- engaged with the English River First Nation and with the Métis Nation‑Saskatchewan regarding the 2021 IEMP at the Key Lake and McArthur River operations
- provided updates to Indigenous Nations and communities on the Canadian Uranium Workers Study and informed communities of how they may become involved in the study, if interested
- continued engagement and consultation activities with several Indigenous Nations and communities on the ongoing environmental assessments at NexGen Energy Ltd.’s Rook I Project and Denison Mines’ Wheeler River Project, both of which are located in northern Saskatchewan
- conducted regular meetings with the Ya’thi Néné Lands and Resources Office, Clearwater River Dene Nation, the Métis Nation-Saskatchewan and English River First Nation
- held meetings directly with Indigenous Nations and communities on Cameco’s request to amend its waste facility operating licence for the Beaverlodge properties and provided updates
- held a meeting with the Clearwater River Dene Nation on Orano’s request to amend its waste facility operating licence for Cluff Lake and provided updates
2 Overview
This report focuses on the regulatory performance of the 5 operating uranium mines and mills in Canada in 2021. During this time frame, 3 of the 5 facilities were in a state of care and maintenance. The facilities listed are located within the Athabasca Basin of northern Saskatchewan and are shown in figure 2.1. Active sites are shown in red, and facilities in a state of care and maintenance in 2021 are shown in black.
- Cigar Lake Operation (mine)
- McArthur River Operation (mine – care and maintenance in 2021)
- Rabbit Lake Operation (mine and mill – care and maintenance in 2021)
- Key Lake Operation (mill – care and maintenance in 2021)
- McClean Lake Operation (mine and mill)
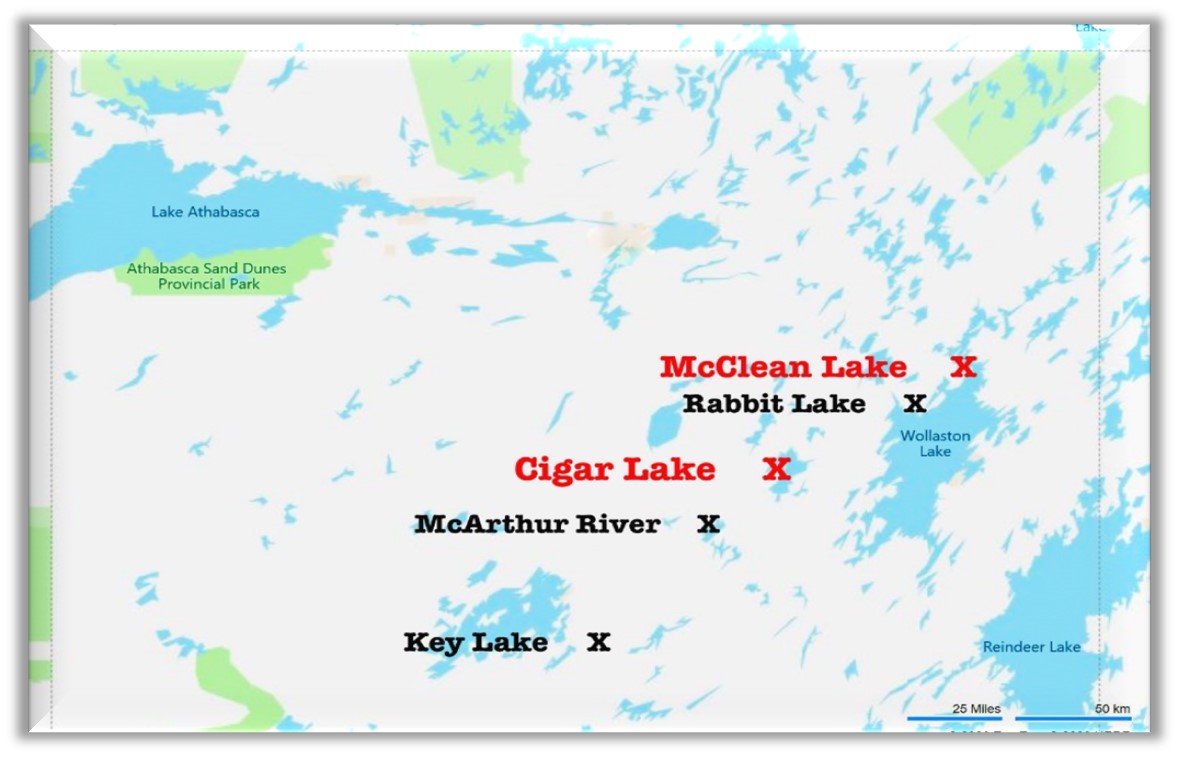
The Cigar Lake, McArthur River, Key Lake and Rabbit Lake facilities are operated by Cameco, while the McClean Lake facility is operated by Orano.
In 2016, Cameco entered the Rabbit Lake mine and mill into a state of care and maintenance, and it has remained in that state since that time. In 2018, Cameco entered the Key Lake and McArthur River operations into a state of care and maintenance, and both have remained in that state to the end of 2021. CNSC inspectors confirmed that staffing levels remained appropriate at all 3 of these facilities, and that workers have the capability and the time needed to perform all expected functions while the facilities are in care and maintenance.
When the licensee reduces a service, such as ventilation volumes, CNSC staff evaluate how the reduction will impact workers in the area. CNSC staff also verify that sufficient protective measures, such as alarming detectors, are in place to warn of potentially unsafe situations. Licensees continue to train workers to understand both the safety implications of the monitors and the actions they need to take if any condition triggers an alarm. CNSC staff review changes that may impact licensed activities to ensure that the licensee maintains an equivalent level of safety.
In 2021, CNSC staff continued routine compliance verification inspections at all facilities to determine whether the licensee continued to meet regulatory expectations. The 2021 uranium production data for uranium mine and mill facilities are shown in table 2.1. CNSC staff concluded that all facilities operated within their authorized annual production limits in 2021.
| Production data | Cigar Lake | McArthur River1 | Rabbit Lake1 |
Key Lake1 |
McClean Lake2 |
|---|---|---|---|---|---|
| Mining – ore tonnage (Mkg/year) | 34.3 | 0 | 0 | N/A | 1.21 |
| Mining – average ore grade mined (% U) | 16.6 | N/A | N/A | N/A | 6.8 |
| Mining – U mined (Mkg U/year) | 4.83 | N/A | N/A | N/A | 0.017 |
| Milling – mill ore feed (Mkg/year) | N/A | N/A | 0 | 0 | 35.2 |
| Milling – average mill feed grade (% U) | N/A | N/A | N/A | N/A | 13.82 |
| Milling – mill recovery (% U) | N/A | N/A | N/A | N/A | 98.7 |
| Milling – U concentrate produced (Mkg U/year) | N/A | N/A | 0 | 0 | 4.75 |
| Authorized annual production (Mkg U/year) | 9.25 | 9.6 | 4.25 | 9.60 | 9.23 |
1 McArthur River, Rabbit Lake and Key Lake were in a state of care and maintenance throughout 2021.
2 McClean Lake mill processing ore from Cigar Lake.
N/A = Not applicable
Mkg = 1,000,000 kg
Licensees are required to develop and update preliminary decommissioning plans throughout the entire lifecycle of the facility and provide associated financial guarantees. Financial guarantees ensure that sufficient financial resources are available to fund all approved decommissioning and waste management activities should the licensee not be able to fulfill its obligations. Financial guarantee values for the mine and mill facilities range from approximately C$42 million at the McArthur River Operation to C$223 million at the Key Lake Operation. The values of the financial guarantees for each uranium mine and mill are listed in appendix F. Financial guarantees cover all costs necessary to fully decommission and remediate a uranium mine and/or mill to ensure the protection of people and the environment.
2.1 Performance
CNSC staff use expert professional judgment to rate SCA performance at uranium mine and mill facilities. Ratings are based on the review of key performance indicators (e.g., accident/event occurrences, responses to accidents/events, desktop review of reports, dose information, environmental [radiological and non‑radiological] results) and the results of compliance activities, such as inspections and technical assessments.
The performance ratings are compared across the 5 operating uranium mines and mills and to the rating definitions in appendix D to ensure that consistent ratings are assigned. The SCA performance ratings for the mine and mill facilities are presented in table 2.2; the SCA ratings for each facility from 2017 to 2021 are in appendix E.
| Safety and control area | Cigar Lake | McArthur River | Rabbit Lake |
Key Lake |
McClean Lake |
| Management system | SA | SA | SA | SA | SA |
| Human performance management | SA | SA | SA | SA | SA |
| Operating performance | SA | SA | SA | SA | SA |
| Safety analysis | SA | SA | SA | SA | SA |
| Physical design | SA | SA | SA | SA | SA |
| Fitness for service | SA | SA | SA | SA | SA |
| Radiation protection | SA | SA | SA | SA | SA |
| Conventional health and safety | SA | SA | SA | SA | SA |
| Environmental protection | SA | SA | SA | SA | SA |
| Emergency management and fire protection | SA | SA | SA | SA | SA |
| Waste management | SA | SA | SA | SA | SA |
| Security | SA | SA | SA | SA | SA |
| Safeguards and non‑proliferation | SA | SA | SA | SA | SA |
| Packaging and transport | SA | SA | SA | SA | SA |
SA = satisfactory
This report provides detailed information about 3 SCAs that cover many of the key performance indicators for these facilities. These SCAs are radiation protection, environmental protection, and conventional health and safety. Additional SCAs are covered in each operating site’s respective section of this report.
Licensees are required to develop and maintain management systems that include integrated links to all 14 SCAs. Management systems are the framework that establishes the processes and programs required to ensure that an organization achieves its safety objectives, continuously monitors performance, identifies inadequacies, fosters a healthy safety culture and continually improves that culture. Throughout 2021, CNSC staff reviewed and assessed program performance and key performance indicators through regular compliance verification activities.
For 2021, CNSC staff concluded that the overall performance of the operating uranium mines and mills was satisfactory.
2.2 Radiation protection
Uranium mine and mill licensees in Canada are required to implement and maintain radiation protection programs. Each program must ensure that contamination levels and radiation doses received by individuals are monitored, controlled, maintained below regulatory limits, and kept consistent with the as low as reasonably achievable (ALARA) principle, considering economic and social factors.
For 2021, CNSC staff rated the radiation protection SCA at all 5 operating facilities as “satisfactory” based on regulatory oversight activities.
| Cigar Lake | McArthur River | Rabbit Lake | Key Lake | McClean Lake |
| SA | SA | SA | SA | SA |
SA = satisfactory
Radiological hazard control
Sources of radiation exposure at uranium mines and mills include:
- gamma radiation
- long-lived radioactive dust
- radon progeny
- radon gas
CNSC staff’s compliance activities confirmed that these hazards were controlled by the licensees’ radiation protection programs, including practices relating to the effective use of time, distance and shielding; source control; ventilation; contamination control; and personal protective equipment.
Radiation protection program performance
During 2021, CNSC staff conducted regulatory oversight activities for the radiation protection SCA at all 5 facilities. These activities were carried out to verify that licensees were complying with regulatory requirements for the implementation of radiation protection programs.
Radiation protection programs include codes of practice that outline licensee administrative levels and action levels for exposures and doses of radiation. Action levels and administrative levels are identified for all radiological hazard types and applied to normal operating conditions, and are followed to ensure optimal conditions for workers. Licensees are responsible for identifying the parameters of their programs that represent timely indicators of potential losses of control. For this reason, action and administrative levels are licensee-specific and may change over time, depending on operational and radiological conditions. If an action level is reached, it may indicate the loss of control of part of a licensee’s radiation protection program. The licensee is then required to establish the cause, notify the CNSC and, if applicable, restore the effectiveness of the radiation protection program.
Administrative levels include a list of specific actions to be taken by the licensee based on radiological monitoring in the workplace. Exceedances of these levels are not reportable to the CNSC. The radiation protection programs include actions to be taken under specific conditions; for example:
- continue to work while monitoring or investigating a parameter
- leave the area and initiate an investigation
As radiation levels or worker exposure levels increase, the required protective actions become more stringent, which is consistent with a risk-informed approach.
The 5 operating uranium mines and mills have the same individual nuclear energy worker (NEW) radiation dose action level of 1 millisievert (mSv) per week and 5 mSv per quarter of a given year.
CNSC staff confirmed that during the reporting period, the radiation protection programs and practices at uranium mines and mills remained effective at controlling radiological exposure to workers.
Application of ALARA
The radiation protection programs implemented by uranium mine and mill licensees include responsibilities and processes for ensuring that exposures to workers are consistent with the ALARA principle.
Through compliance verification activities and desktop reviews, CNSC staff verified that key elements of these ALARA programs (e.g., management control over work practices, personnel qualification and training, control of occupational and public exposure to radiation, planning for unusual situations) were effectively implemented by uranium mine and mill facilities in 2021.
This report includes the reporting of annual collective dose values for NEWs for each mine and mill (see sections 3.2, 4.2, 5.2, 6.2 and 7.2). The collective dose value is the sum of the effective doses received by all NEWs at a given site over a calendar year. Collective dose is a radiation protection performance indicator that provides the total exposures associated with each operation. It supplements other performance statistics, like average dose, that have been affected by factors including changes in the number of workers or workers who receive radiation exposures over very short periods of time. Collective dose shows the effect of increased or reduced facility activities, as a result of care and maintenance status or as a response to the COVID-19 pandemic, for example.
Worker dose control
In accordance with the Radiation Protection Regulations Footnote 5, uranium mine and mill licensees’ radiation protection programs include processes and criteria to provide assurance that all individuals identified as NEWs under section 2 of the Nuclear Safety and Control Act Footnote 1 are appropriately designated and trained. This includes licensees’ employees and contractors. Radiation exposures are ascertained through approved dosimetry methods, and workers are notified of the results.
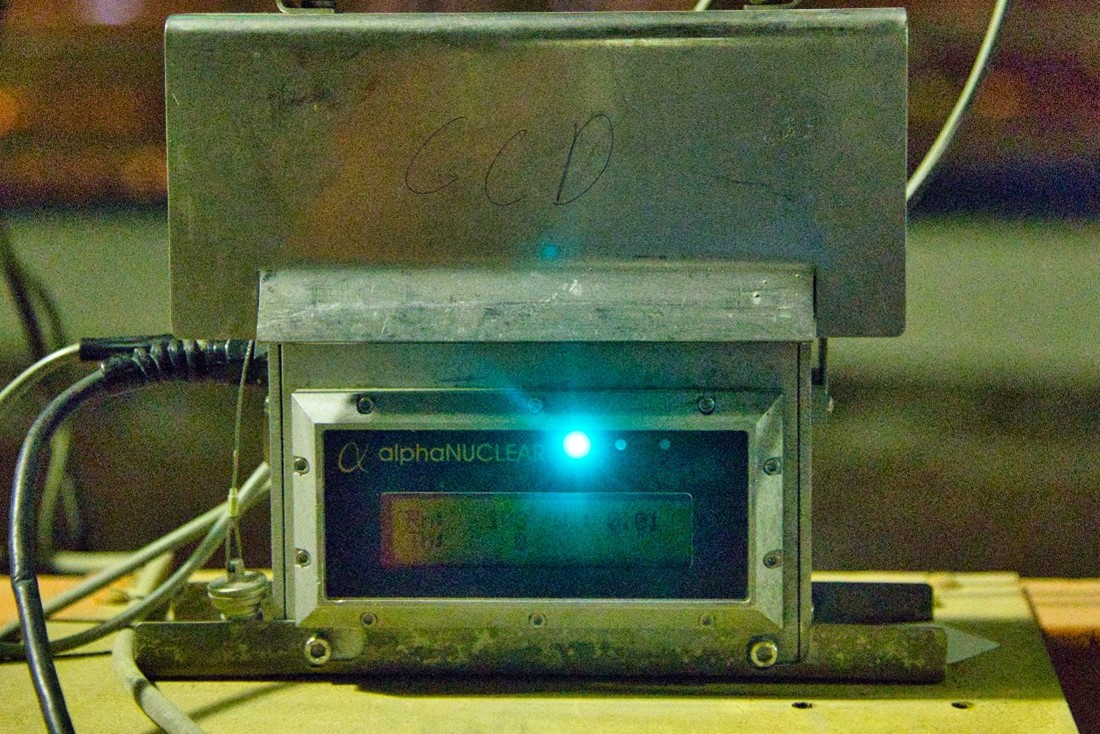
Source: CNSC
At all operating uranium mines and mills, NEWs are issued optically stimulated luminescence dosimeters that measure external gamma radiation exposure. Where required, workers also wear personal alpha dosimeters (PADs) to measure internal alpha radiation exposure from radon progeny and long-lived radioactive dust (LLRD). Optically stimulated luminescence dosimeters and PAD readings are measured by CNSC-licensed dosimetry service providers. Where direct monitoring through dosimeters is not warranted or practical, dose estimation methods authorized under the Radiation Protection Regulations Footnote 5 (such as area/group monitoring and time cards) are used in keeping with CNSC regulatory guidance. CNSC staff confirmed that all licensees for the facilities discussed in this section of the report met the regulatory requirements for the use of licensed dosimetry during the reporting period.
Figures 2.3 and 2.4 show the average individual effective dose and maximum individual effective dose during the 5-year period from 2017 to 2021 for the 5 facilities. In 2021, no worker at any facility exceeded the regulatory individual effective dose limit of 50 mSv in 1 year and 100 mSv in a 5-year dosimetry period.
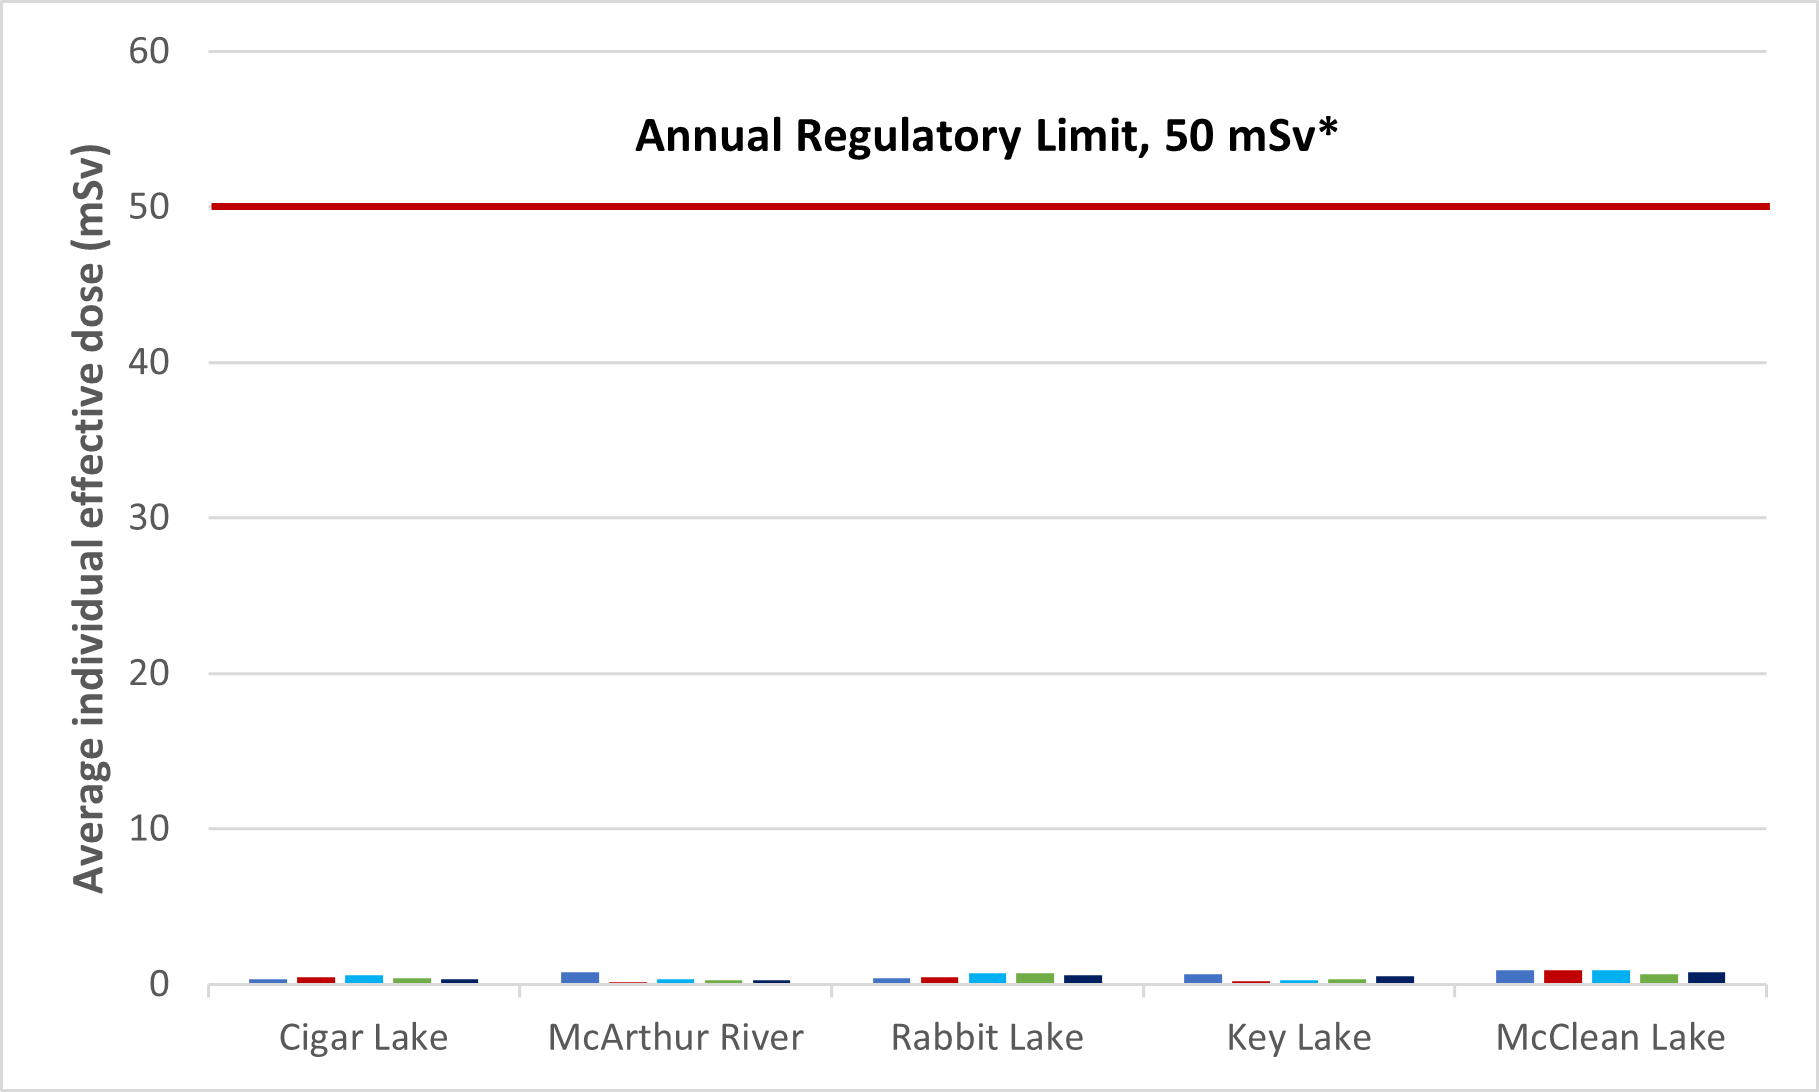
Figure 2.3: Text version
A graph showing the average individual effective dose to nuclear energy workers at uranium mines and mills from 2017 to 2021. The annual regulatory limit is 50 milliSieverts. The table shows the average individual effective dose values to nuclear energy workers for the five operating facilities for the same
| Cigar Lake (mSv) | McArthur River (mSv) | Rabbit Lake (mSv) | Key Lake mSv) | McClean Lake (mSv) | |
|---|---|---|---|---|---|
| 2017 | 0.34 | 0.79 | 0.4 | 0.66 | 0.91 |
| 2018 | 0.47 | 0.15 | 0.46 | 0.19 | 0.9 |
| 2019 | 0.57 | 0.33 | 0.75 | 0.27 | 0.93 |
| 2020 | 0.38 | 0.27 | 0.7 | 0.35 | 0.67 |
| 2021 | 0.32 | 0.25 | 0.57 | 0.52 | 0.79 |
*No regulatory limits exist for average dose to NEWs; annual dose limit used for reference.
Increases and decreases over time in the effective dose to NEWs are explained in the facility-specific sections of this report, in the subsection on worker dose control.
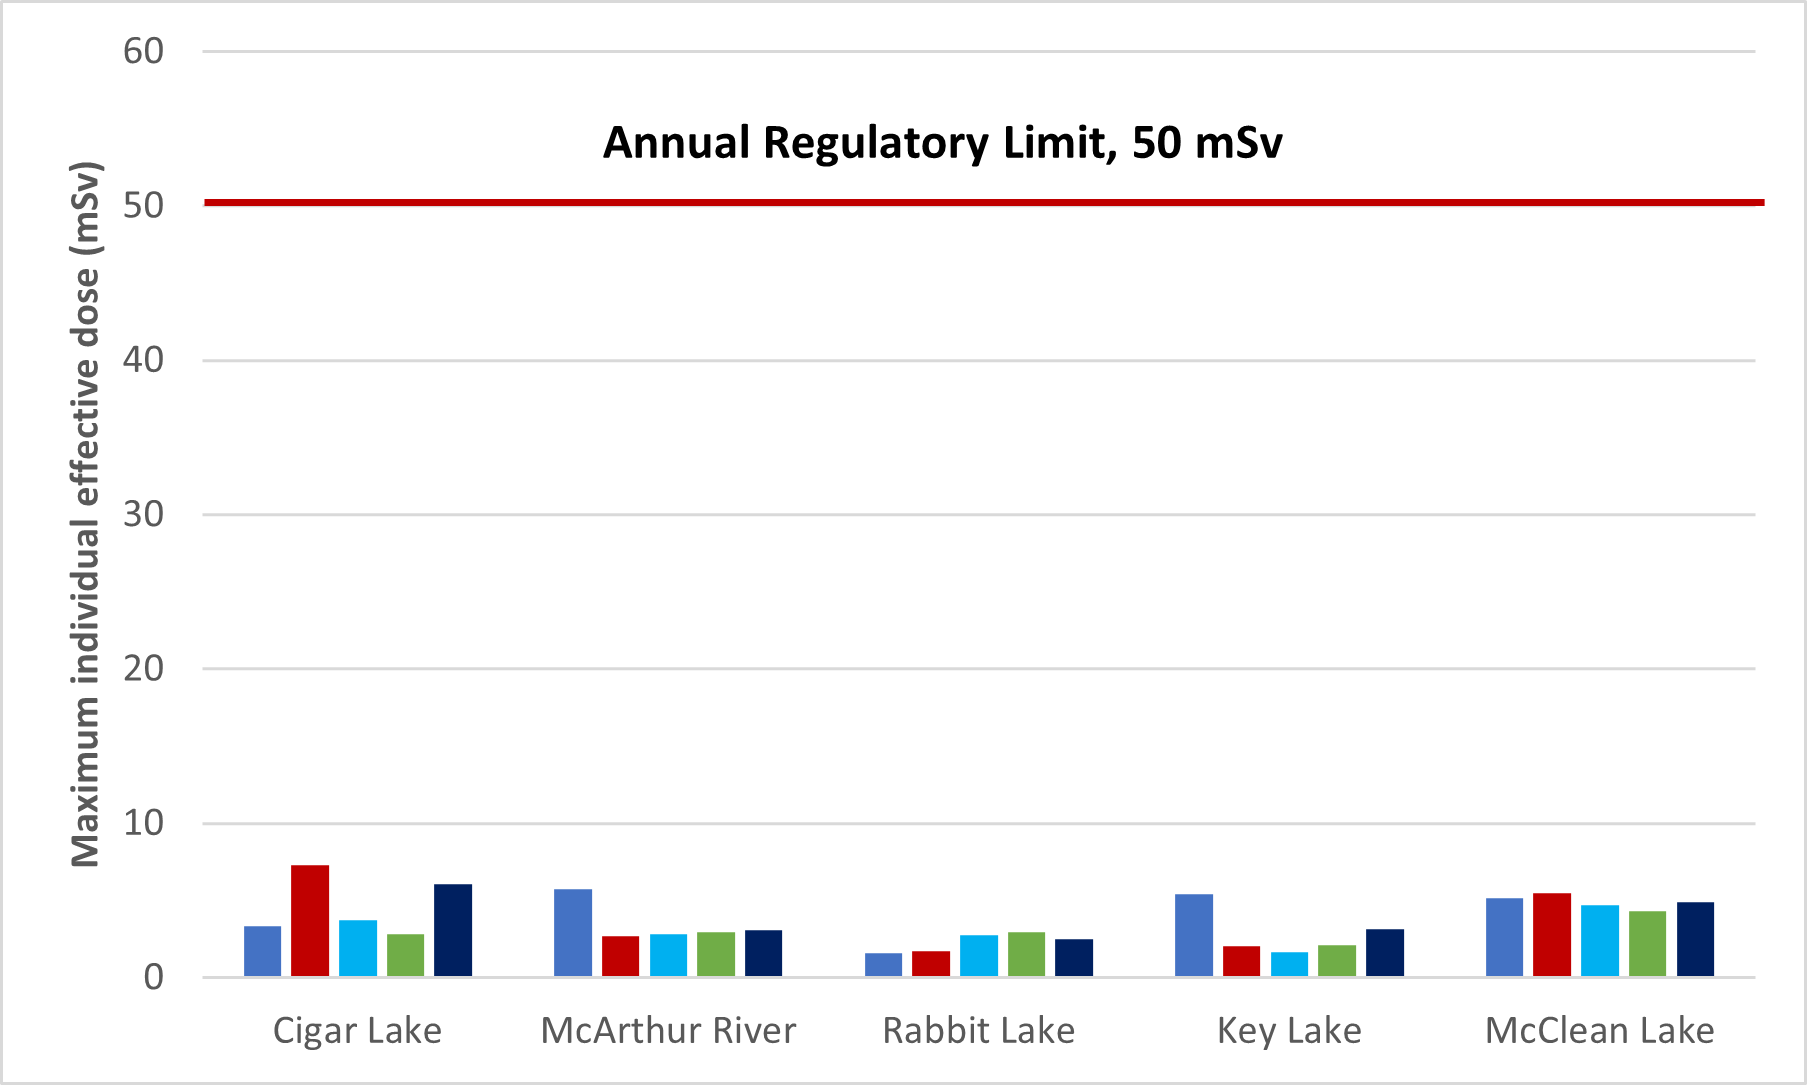
Figure 2.4: Text version
A graph showing the maximum individual effective dose to nuclear energy workers at uranium mines and mills from 2017 to 2021. The annual regulatory limit is 50 milliSieverts. The table shows the maximum individual effective dose values to nuclear energy workers for the five operating facilities for the same period.
| Cigar Lake (mSv) | McArthur River (mSv) | Rabbit Lake (mSv) | Key Lake (mSv) | McClean Lake (mSv) | |
|---|---|---|---|---|---|
| 2017 | 3.36 | 5.73 | 1.56 | 5.39 | 5.12 |
| 2018 | 7.28 | 2.67 | 1.7 | 2.02 | 5.5 |
| 2019 | 3.7 | 2.82 | 2.73 | 1.64 | 4.7 |
| 2020 | 2.82 | 2.94 | 2.93 | 2.11 | 4.28 |
| 2021 | 6.03 | 3.06 | 2.47 | 3.13 | 4.89 |
The highest maximum individual effective dose to a worker at a uranium mine or mill in 2021 occurred at the Cigar Lake Operation. The worker at Cigar Lake was assigned a dose of 6.03 mSv, a value that is 12.1% of the annual dose limit of 50 mSv. This dose is linked to an action level exceedance described in section 3.2.
Appendix G shows the number of NEWs and the corresponding average individual effective dose and maximum individual effective dose for each facility from 2017 to 2021.
2.3 Environmental protection
Uranium mine and mill licensees in Canada are required to implement and maintain environmental protection programs, which include a set of action levels. Each program must ensure to identify, control and monitor all releases of radioactive and hazardous substances, and the effects on the environment from facilities or as the result of licensed activities.
Based on regulatory oversight activities, CNSC staff rated the 2021 performance of all 5 operating uranium mine and mill facilities for the environmental protection SCA as “satisfactory”. CNSC staff concluded that the licensees’ environmental protection programs were effectively implemented and sufficiently effective.
| Cigar Lake | McArthur River | Rabbit Lake | Key Lake | McClean Lake |
|---|---|---|---|---|
| SA | SA | SA | SA | SA |
SA = satisfactory
2.3.1 Environmental management system
The CNSC requires licensees to develop and maintain environmental management systems that provide a framework for integrated activities related to environmental protection at their operations. Environmental management systems are described in approved environmental management programs and include activities such as establishing annual environmental objectives, goals and targets. The licensees conduct internal audits of their programs as identified in their CNSC-approved management system program. CNSC staff confirmed the licensees’ objectives, goals and targets through regular compliance verification activities. Facility-specific details are provided in sections 3.3, 4.3, 5.3, 6.3 and 7.3 of this report.
2.3.2 Effluent and emissions control
Effluent and emissions control programs are associated with an environmental code of practice that sets out administrative levels and action levels for select contaminants of potential concern (COPCs) with the potential for adverse environmental effects. An administrative level represents the upper range of design specifications for a specific parameter. Reaching an administrative level triggers an internal review by the licensee. Exceedance of an action level indicates a potential loss of control of the environmental protection program, which is based on the approved facility design envelope; it triggers notification to the CNSC, an immediate investigation, subsequent corrective actions, and preventive measures in order to restore the effectiveness of the environmental protection program. It is important to recognize that an exceedance of an action level does not imply a potential risk to the environment, but rather, identifies that the operating parameter may be outside the facility design envelope. Facility action levels are determined using actual operating data and following the methodology described in CSA Group standard N288.8-17, Establishing and Implementing Action Levels for Releases to the Environment from Nuclear Facilities Footnote 6.
Treated effluent released to the environment
Environmental risk assessments (ERAs) identified releases of molybdenum, selenium and uranium, with the potential for adverse environmental effects at uranium mines and mills. As a result, improved engineering controls and treatment technologies to reduce effluent releases of these contaminants were implemented where required. In 2021, the treatment technologies implemented continued to keep these contaminant concentrations stable and below regulatory limits. Figures 2.5 to 2.7 show the 2021 average annual effluent concentrations for molybdenum, selenium and uranium at the 5 mine and mill facilities.
In the absence of federal or provincial effluent discharge limits for molybdenum, the CNSC required licensees to develop facility-specific effluent controls within the codes of practice of their environmental protection programs. The 2017 to 2021 average concentrations of molybdenum in effluent for each facility were below the most stringent action level used across the 5 operating facilities, that is, 1.0 mg/L used at Key Lake and McArthur River. This level is shown in figure 2.5 for reference only.
Figure 2.5: Annual average concentration of molybdenum in effluent released to the environment, 2017–21
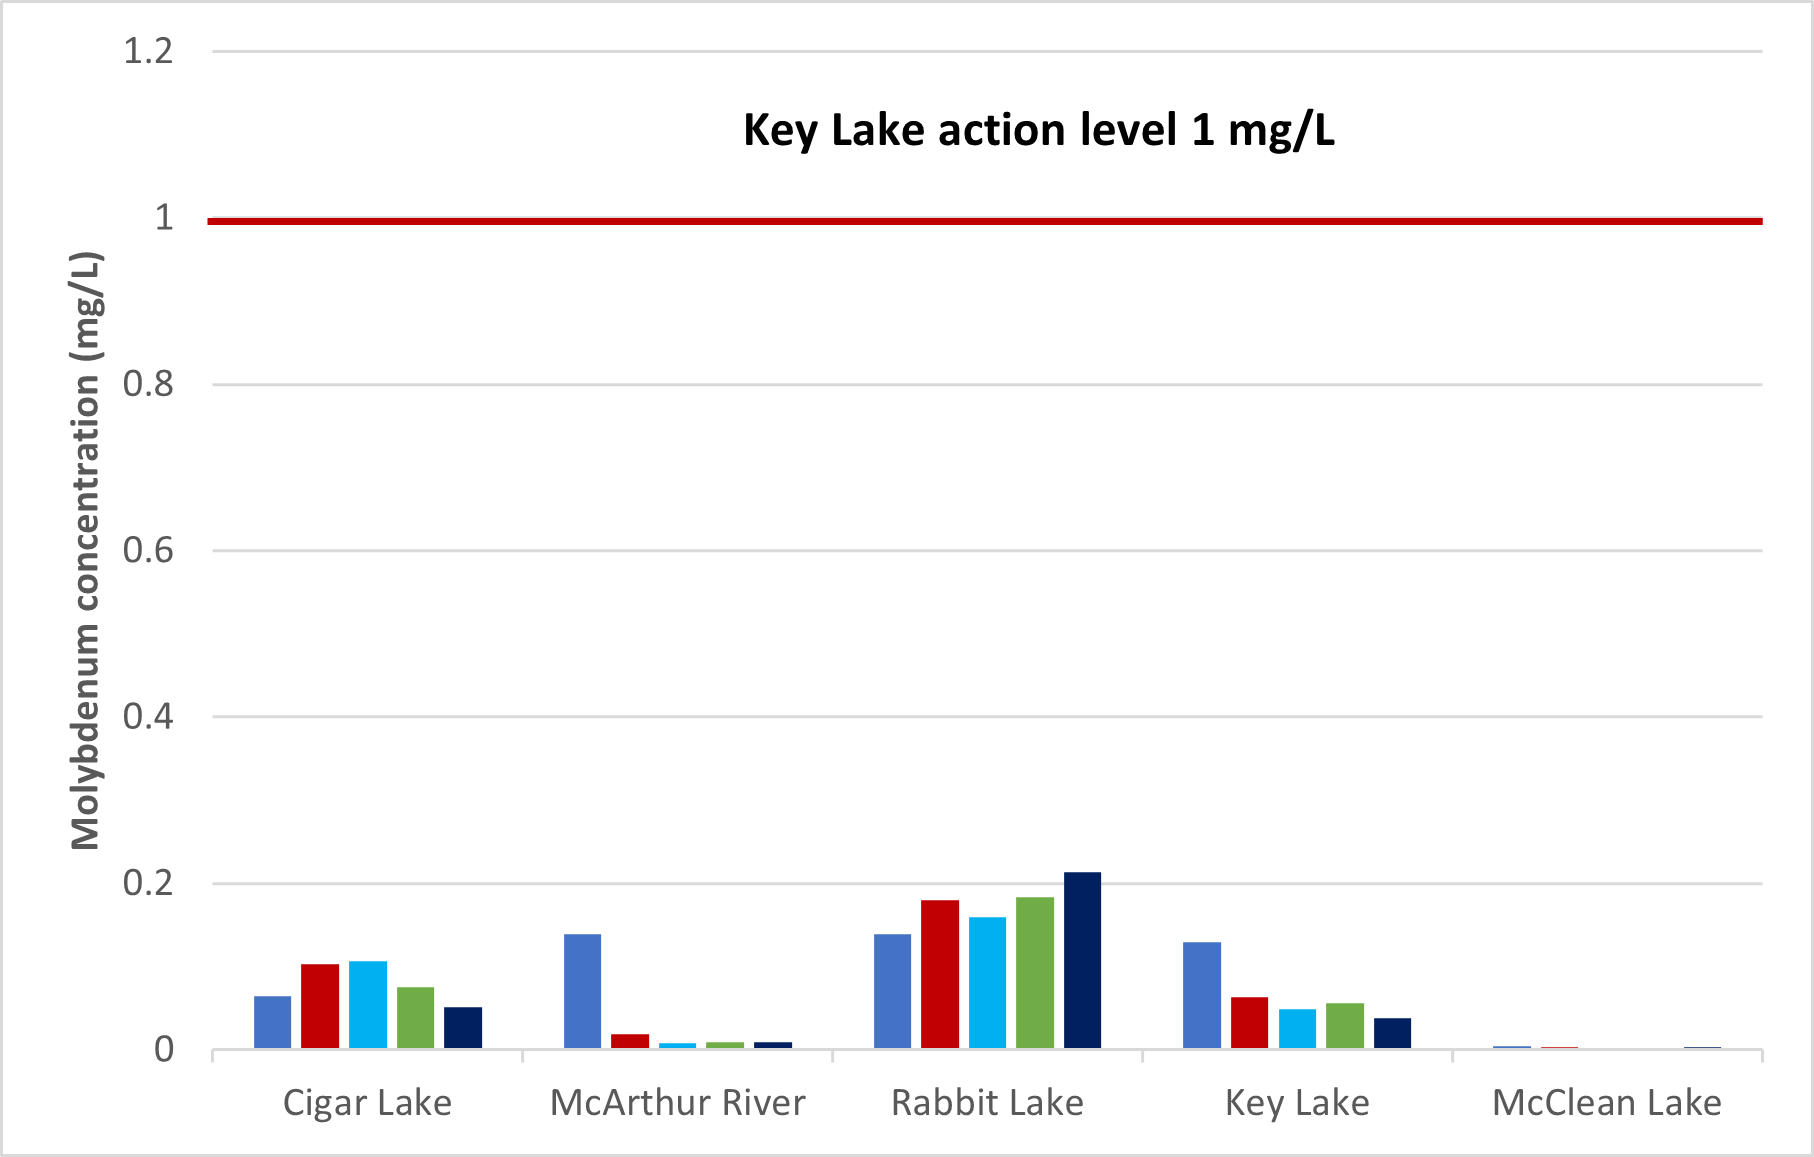
Figure 2.3: Text version
A graph showing the annual average concentration of molybdenum in effluent released to the environment at uranium mines and mills from 2017 to 2021. The table shows the average concentration of molybdenum values for the five operating facilities for the same period.
| Cigar Lakeh (mg/L) | McArthur River (mg/L) | Rabbit Lake (mg/L) | Key Lake (mg/L) | McClean Lake (mg/L) | |
|---|---|---|---|---|---|
| 2017 | 0.064 | 0.1393 | 0.139 | 0.129 | 0.004 |
| 2018 | 0.103 | 0.0192 | 0.18 | 0.063 | 0.003 |
| 2019 | 0.1069 | 0.0084 | 0.159 | 0.049 | 0.002 |
| 2020 | 0.0756 | 0.0094 | 0.184 | 0.056 | 0.002 |
| 2021 | 0.0515 | 0.0089 | 0.213 | 0.038 | 0.003 |
Figures 2.6 and 2.7 show that concentrations of selenium and uranium in treated effluent released to the environment by mine and mill facilities from 2017 to 2021 remained below the licensed maximum monthly mean effluent discharge limits of 0.6 mg/L and 2.5 mg/L respectively. As indicated in figure 2.7, the CNSC identified an interim objective for uranium of 0.1 mg/L. This was derived from the treatment technologies in place at the uranium mines and mills and based on what would be achievable by the uranium metal mining sector. The interim objective was applied to all uranium mine and mill facilities since it was the most stringent and has been consistently met since 2016.
The interim objective for uranium in effluent is in place until CNSC REGDOC‑2.9.2, Controlling Releases to the Environment, is approved by the Commission and implemented by licensees. Draft REGDOC-2.9.2, which was made available for public consultation from May 2021 to July 2021, contains proposed requirements and guidance for establishing and implementing licensed release limits. CNSC staff presented that regulatory document to the Commission in September 2022, and should it be approved, CNSC staff will implement it via the established process.
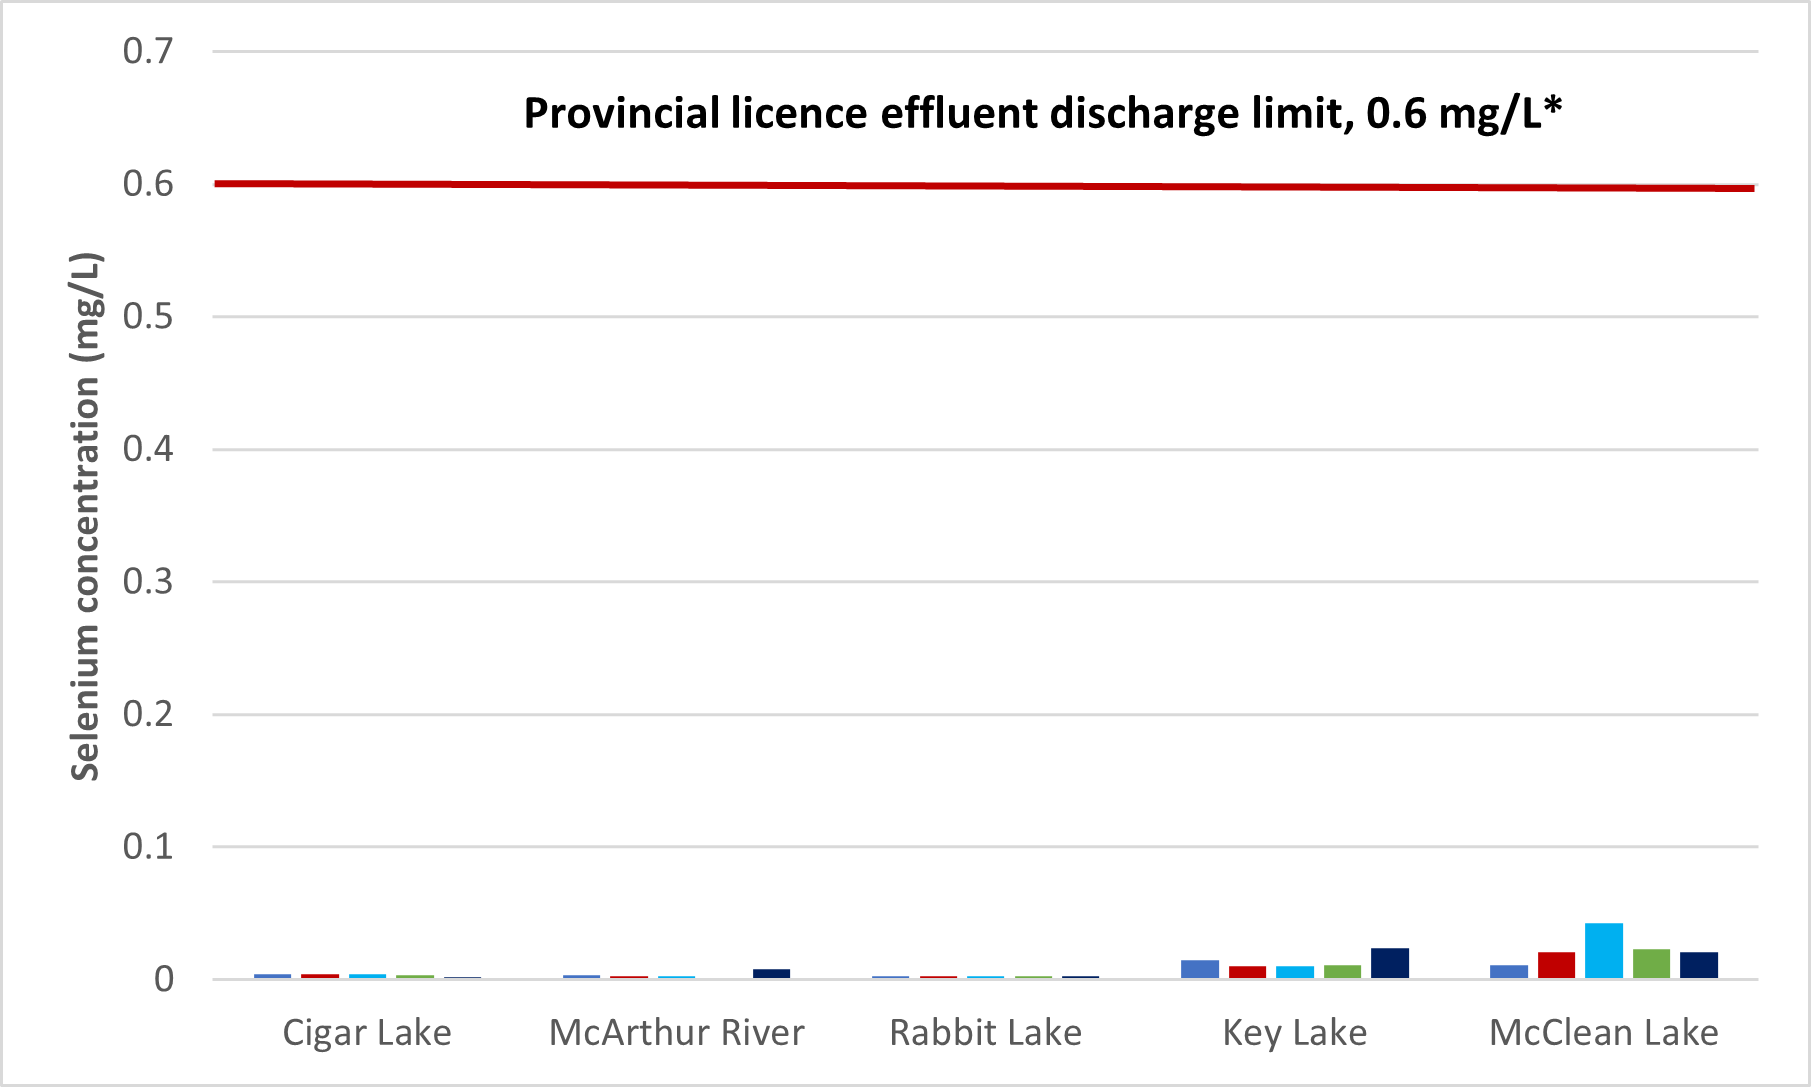
Figure 2.6: Text version
A graph showing the annual average concentration of selenium in effluent released to the environment at uranium mines and mills from 2017 to 2021. The table shows the average concentration of selenium values for the five operating facilities for the same period.
| Cigar Lake (mg/L) | McArthur River (mg/L) | Rabbit Lake (mg/L) | Key Lake (mg/L) | McClean Lake (mg/L) | |
|---|---|---|---|---|---|
| 2017 | 0.0042 | 0.0036 | 0.0024 | 0.015 | 0.011 |
| 2018 | 0.0044 | 0.0023 | 0.0026 | 0.01 | 0.021 |
| 2019 | 0.0041 | 0.0024 | 0.0023 | 0.01 | 0.037 |
| 2020 | 0.0034 | 0.0003 | 0.0026 | 0.011 | 0.042 |
| 2021 | 0.002 | 0.0003 | 0.0025 | 0.010 | 0.0211 |
*Provincial effluent limit: 0.6 mg/L
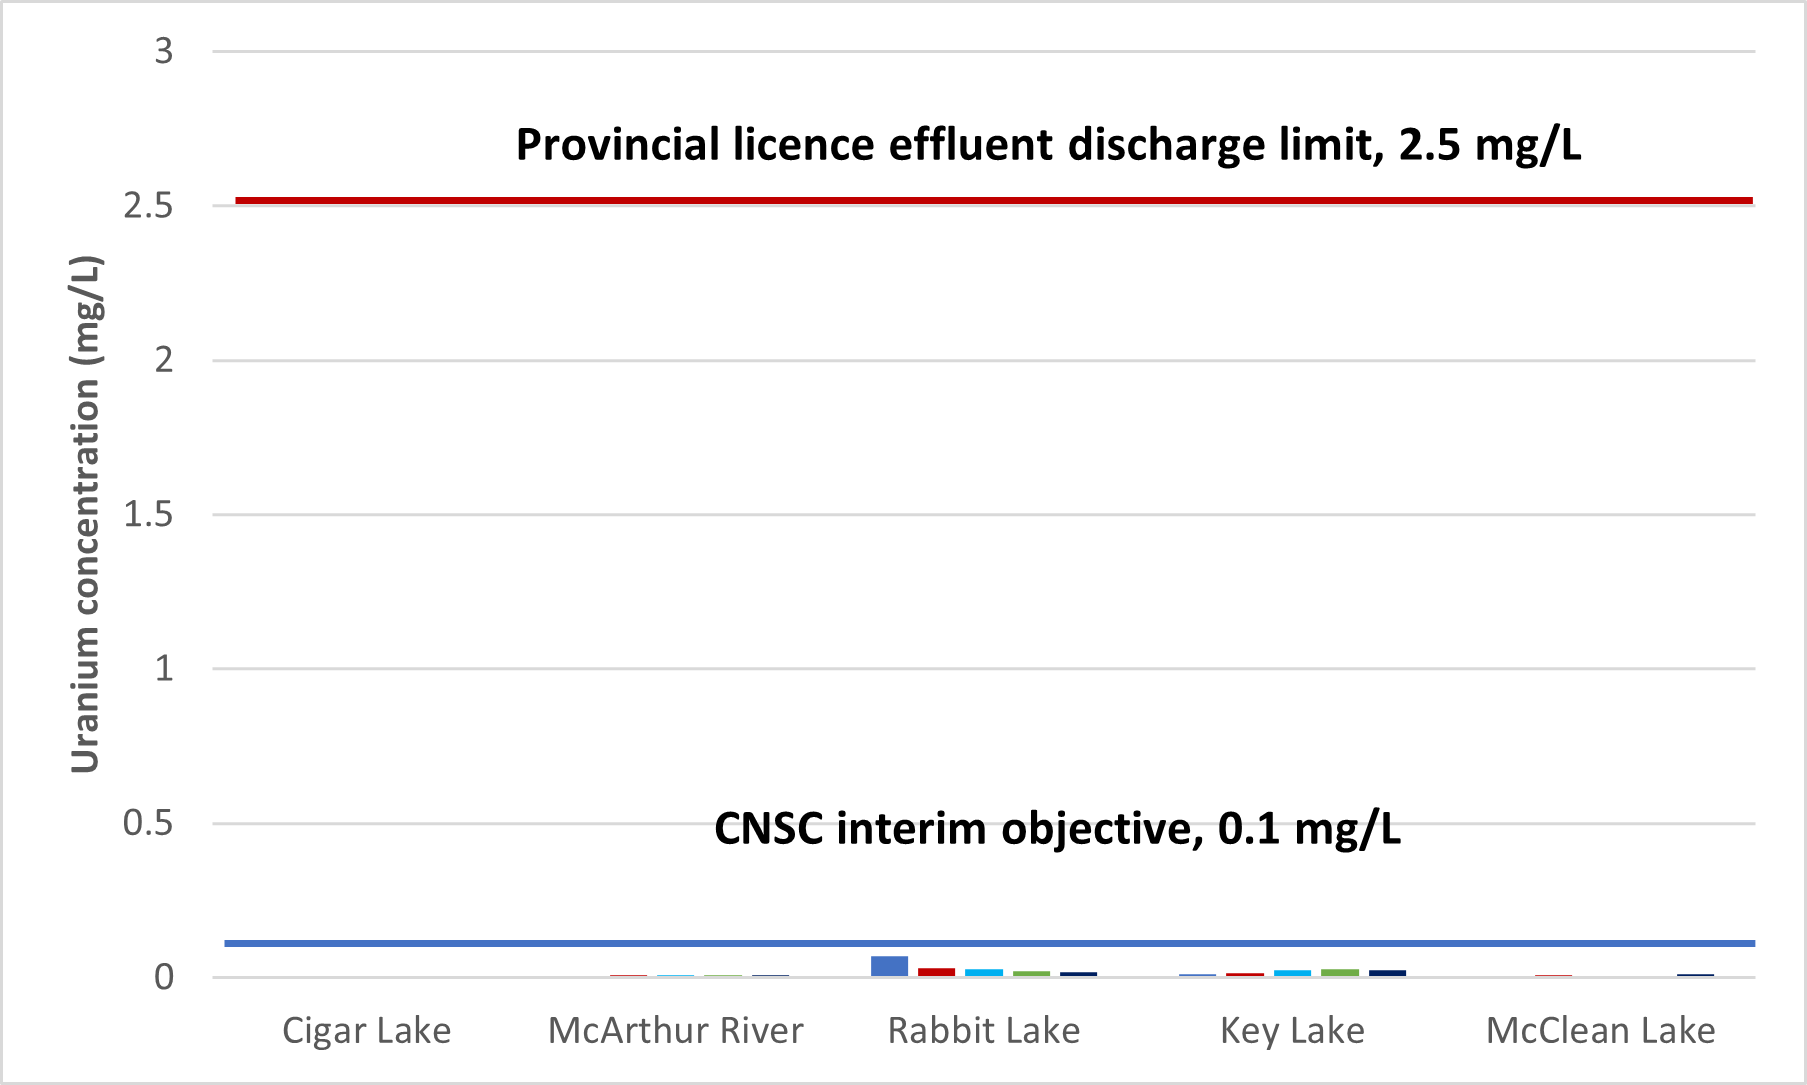
Figure 2.7: Text version
A graph showing the annual average concentration of uranium in effluent released to the environment at uranium mines and mills from 2017 to 2021. The table shows the average concentration of uranium values for the five operating facilities for the same period.
| Cigar Lake (mg/L) | McArthur River (mg/L) | Rabbit Lake (mg/L) | Key Lake (mg/L) | McClean Lake (mg/L) | |
|---|---|---|---|---|---|
| 2017 | 0.0018 | 0.0056 | 0.07 | 0.011 | 0.004 |
| 2018 | 0.0005 | 0.0071 | 0.032 | 0.013 | 0.007 |
| 2019 | 0.0004 | 0.0086 | 0.027 | 0.0243 | 0.005 |
| 2020 | 0.0002 | 0.0084 | 0.021 | 0.0259 | 0.005 |
| 2021 | 0.0001 | 0.0082 | 0.018 | 0.0239 | 0.0098 |
Appendix L includes information on the total annual release of relevant radionuclides to the environment from these facilities from 2017 to 2021.
Uranium mines and mills, like other industrial activities in Canada, must respect the reporting requirements of the National Pollutant Release Inventory (NPRI) Footnote 7. There was a 2016 request from non-governmental organizations to include radionuclides as reportable substances under the NPRI. Environment and Climate Change Canada (ECCC) reviewed this request and determined that radionuclides were not reportable substances under the NPRI as releases were monitored and reported by another government agency, the CNSC Footnote 7. This is the last year this information will be presented in the regulatory oversight report.
To increase public access to data on releases of radionuclides to the environment from nuclear facilities, the CNSC provides this information in the appendices of this regulatory oversight report and maintains and annually updates downloadable databases on the CNSC Open Government portal.
In addition to the above COPCs with the potential for adverse environmental effects, a graph showing concentrations of radium is provided in figure 2.8. From 2017 to 2021, the annual average effluent concentrations of radium-226 for the 5 facilities were well below the CNSC’s licence-authorized monthly mean effluent discharge limit of 0.37 Bq/L.
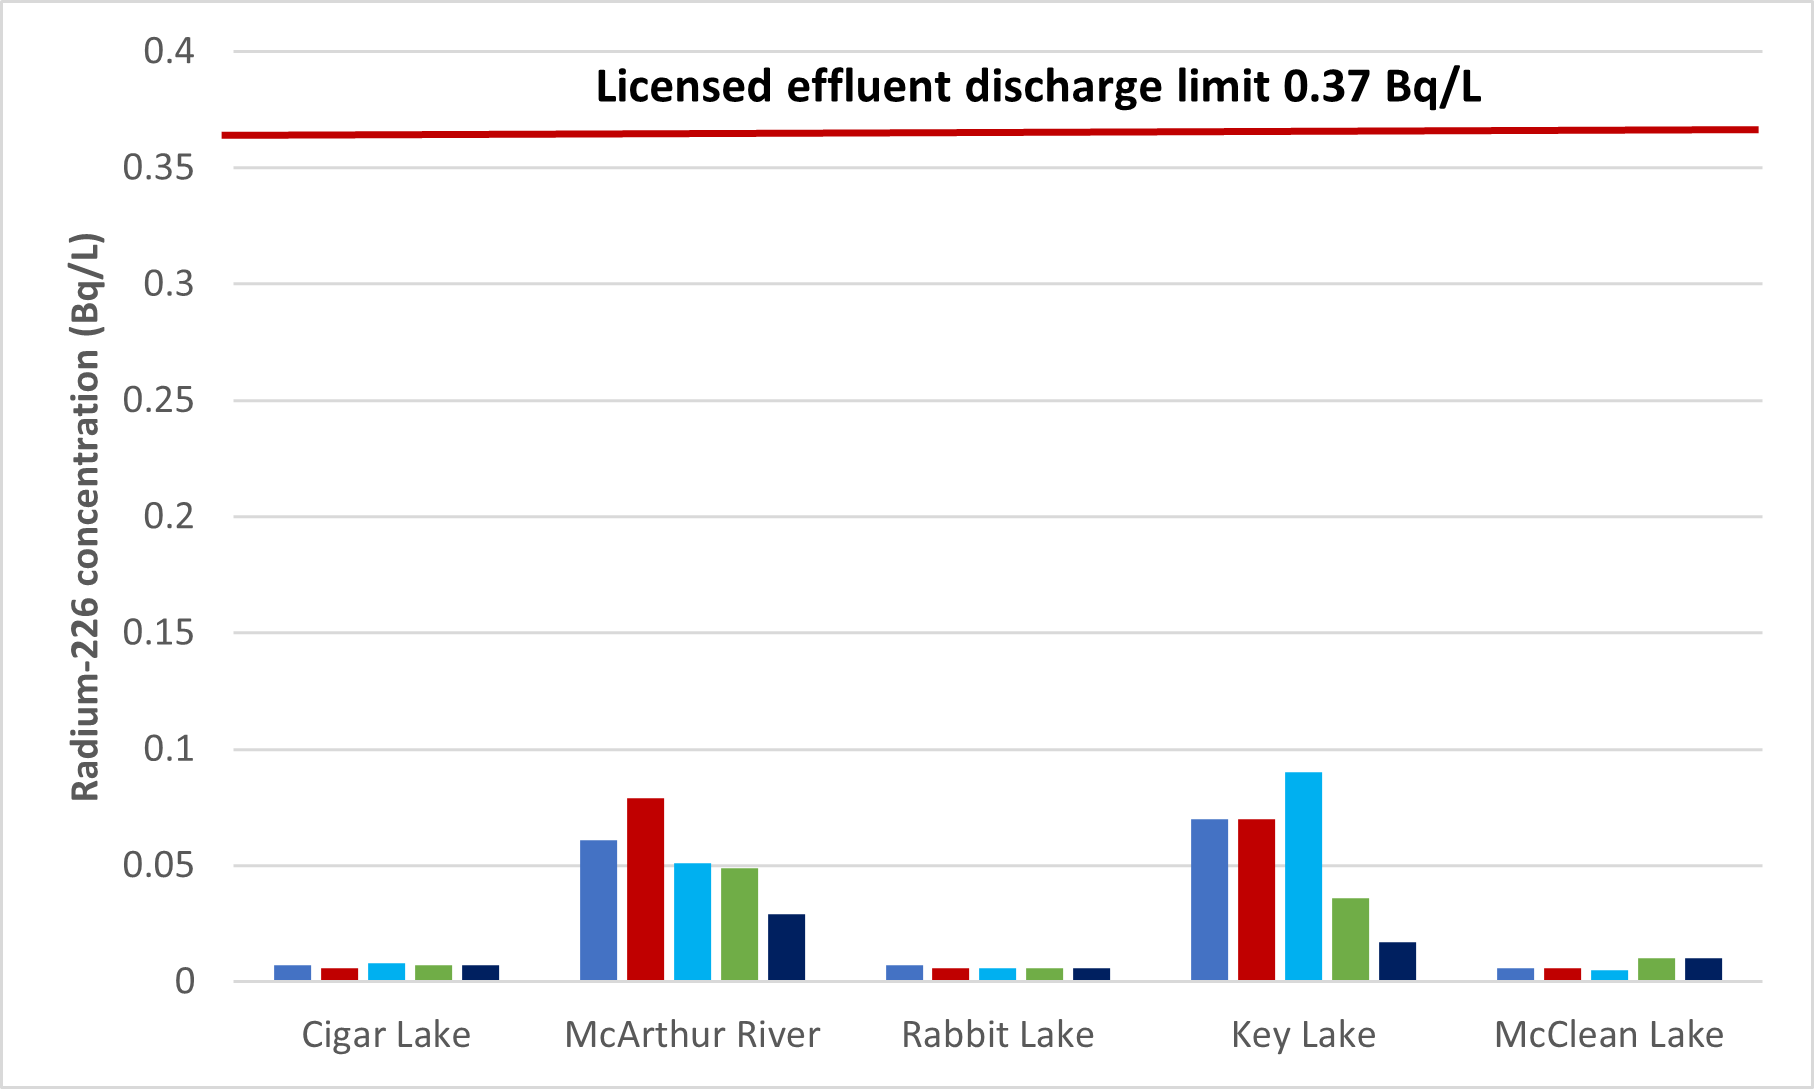
Figure 2.8: Text version
A graph showing the annual average concentration of radium-226 in effluent released to the environment at uranium mines and mills from 2017 to 2021. The table shows the average concentration of radium-226 values for the five operating facilities for the same period.
|
Cigar Lake (Bq/L) |
McArthur River (Bq/L) | Rabbit Lake (Bq/L) |
Key Lake (Bq/L) |
McClean Lake (Bq/L) | |
|---|---|---|---|---|---|
| 2017 | 0.007 | 0.061 | 0.007 | 0.07 | 0.006 |
| 2018 | 0.006 | 0.079 | 0.006 | 0.07 | 0.006 |
| 2019 | 0.008 | 0.051 | 0.006 | 0.09 | 0.006 |
| 2020 | 0.007 | 0.049 | 0.006 | 0.036 | 0.010 |
| 2021 | 0.007 | 0.029 | 0.006 | 0.017 | 0.010 |
Uranium mine and mill facilities also analyze treated effluent for concentrations of other regulated contaminants and COPCs, such as arsenic, copper, lead, nickel, zinc, total suspended solids (TSS) and pH. Table 2.3 shows the annual average parameter concentration values in effluent for these substances released in 2021, as well as the discharge limits described in the Metal and Diamond Mining Effluent Regulations (MDMER) [Footnote 8, made under the Fisheries Act Footnote 9. All metal mines and mills in Canada are subject to the MDMER. The CNSC incorporates the effluent limit requirements of the MDMER into uranium mine and mill licences. In 2021, all treated effluent released to the environment from licensed mining and milling activities for the above substances met the effluent discharge limits.
| Parameters | MDMER discharge limits | Cigar Lake | McArthur River | Rabbit Lake | Key Lake | McClean Lake |
|---|---|---|---|---|---|---|
| Arsenic (mg/L) | 0.3* | 0.0649 | 0.0001 | 0.0012 | 0.0109 | 0.044 |
| Copper (mg/L) | 0.3 | 0.0004 | 0.0005 | 0.0002 | 0.002 | 0.002 |
| Lead (mg/L) | 0.2 | 0.0001 | 0.0001 | 0.0001 | 0.0004 | 0.0005 |
| Nickel (mg/L) | 0.5 | 0.0007 | 0.0022 | 0.0014 | 0.094 | 0.016 |
| Zinc (mg/L) | 0.5 | 0.0293 | 0.0024 | 0.0009 | 0.005 | 0.002 |
| Molybdenum (mg/L) | 1** | 0.0515 | 0.0089 | 0.213 | 0.038 | 0.004 |
| Selenium (mg/L) | 0.6*** | 0.0020 | 0.0003 | 0.0025 | 0.010 | 0.020 |
| TSS (mg/L) | 15 | 1 | 1 | 1 | 1.7 | 2.2 |
| Un-ionized ammonium (mg/L) | 0.5 | 0.01 | <0.01 | 0.01 | 0.02 | 0.02 |
| pH annual mean value | 6.0–9.5 | 7.18 | 7.39 | 7.18 | 7.0 | 7.10 |
*MDMER discharge limit changed in 2021 from 0.5 mg/L to 0.3 mg/L
**Key Lake action level
***Saskatchewan provincial limit
CNSC staff will continue to review effluent quality results to verify that effluent treatment performance remains effective.
Treated mining/milling effluent: A comparison of the uranium mining sector to other metal mining sectors across Canada
As noted earlier, metal mines and mills in Canada are subject to the MDMER Footnote 8, made under the federal Fisheries Act Footnote 9. Compliance with MDMER limits provides a good comparison of the effluent treatment in the uranium mining sector to other metal mining sectors across Canada. The quality of the effluent treatment at the uranium mine and mill facilities compares favorably to that in other mining sectors of base metal, precious metal and iron mines.
The data used for this comparison are acquired from ECCC. Figure 2.9 and tables 2.4 and 2.5 provide the sector-specific MDMER Footnote 8 information available for 2018 for effluent constituents of molybdenum, selenium and uranium. ECCC effluent quality data for 2017 and 2018 for arsenic, copper, nickel, lead, zinc, pH, TSS and acute lethality testing was not available at the time of writing this report.
A comparison of these parameters for the most recent MDMER data available (2016) is presented in the Regulatory Oversight Report for Uranium Mines, Mills, Historic and Decommissioned Sites in Canada: 2017 Footnote 10. The 2017 regulatory oversight report concluded that the uranium sector was similar to or better than the other 3 metal mining sectors with regard to the following performance indicators: effluent concentrations, compliance with regulatory limits, and toxicity test results.
The mines that published treated effluent reporting under the MDMER Footnote 8 are grouped into 4 metal mining sectors based on the primary metal produced. The metal mining sectors are:
- uranium – 5 facilities
- base metals (such as copper, nickel, molybdenum or zinc) – 47 facilities
- precious metals (such as gold or silver) – 56 facilities
- iron – 8 facilities
The MDMER Footnote 8 require routine monitoring of molybdenum concentrations in treated effluent. Ecological risk assessments completed in the mid-2000s indicated that releases of molybdenum posed a risk to biota that warranted adaptive management. Following a request from the Commission, licensees added administrative controls and treatment technology upgrades to their effluent management systems. The success of these actions is evident in figure 2.9, which shows that molybdenum releases in the uranium mining sector have decreased substantially.
In 2021, molybdenum concentrations in uranium mining effluent were similar to those measured in precious metal and iron mine effluent, and lower than those measured in base metal mine effluent.
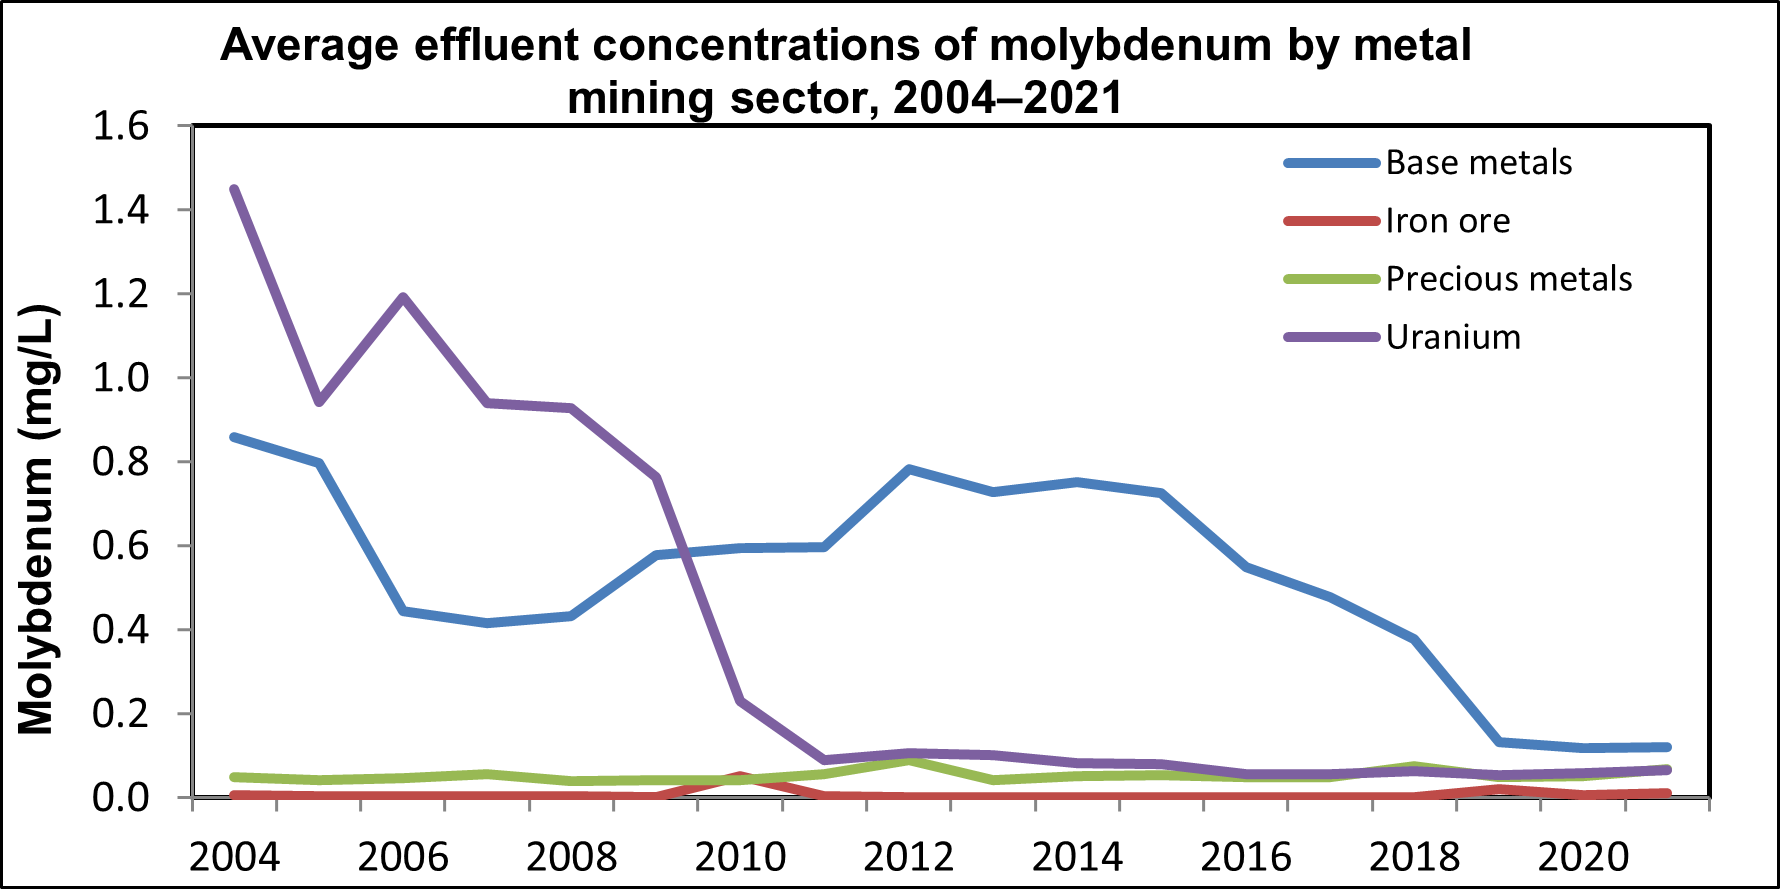
Figure 2.9: Text version
A graph showing the annual average concentration of molybdenum (measured in mg/L) in effluent released to the environment by metal mining sector from 2004 to 2020
| Base Metals | Iron Ore | Precious Metals | Uranium | |
|---|---|---|---|---|
| 2004 | 0.86 | 0.01 | 0.05 | 1.45 |
| 2005 | 0.80 | 0.00 | 0.04 | 0.94 |
| 2006 | 0.44 | 0.00 | 0.05 | 1.19 |
| 2007 | 0.41 | 0.00 | 0.06 | 0.94 |
| 2008 | 0.43 | 0.00 | 0.04 | 0.93 |
| 2009 | 0.58 | 0.00 | 0.04 | 0.76 |
| 2010 | 0.59 | 0.05 | 0.04 | 0.23 |
| 2011 | 0.60 | 0.00 | 0.06 | 0.09 |
| 2012 | 0.78 | 0.00 | 0.09 | 0.11 |
| 2013 | 0.73 | 0.00 | 0.04 | 0.10 |
| 2014 | 0.75 | 0.00 | 0.05 | 0.08 |
| 2015 | 0.72 | 0.00 | 0.05 | 0.08 |
| 2016 | 0.55 | 0.00 | 0.05 | 0.06 |
| 2017 | 0.48 | 0.00 | 0.05 | 0.06 |
| 2018 | 0.38 | 0.00 | 0.07 | 0.06 |
| 2019 | 0.18 | 0.01 | 0.05 | 0.05 |
| 2020 | 0.12 | 0.00 | 0.06 | 0.06 |
In mid-2012, the requirement to monitor selenium was added to the Metal Mining Effluent Regulations. Table 2.4 summarizes the average selenium concentration in treated effluent from each mining sector using data collected since 2012. The selenium concentration in uranium-sector effluent was similar to that of other metal mining sectors in Canada.
| Year | Metal mining sector | |||
|---|---|---|---|---|
| Uranium (mg/L) | Base metals (mg/L) | Precious metals (mg/L) | Iron (mg/L) | |
| 2012/2013 | 0.003 | 0.005 | 0.005 | 0.001 |
| 2014 | 0.004 | 0.006 | 0.005 | 0.001 |
| 2015 | 0.004 | 0.005 | 0.004 | 0.004 |
| 2016 | 0.008 | 0.006 | 0.003 | 0.003 |
| 2017 | 0.004 | 0.008 | 0.004 | 0.001 |
| 2018 | 0.006 | 0.006 | 0.004 | 0.003 |
| 2019 | 0.007 | 0.009 | 0.006 | 0.002 |
| 2020 | 0.007 | 0.033 | 0.003 | 0.001 |
| 2021 | 0.005 | 0.008 | 0.016 | 0.001 |
Uranium concentrations were added as a parameter to be monitored and reported under the MDMER Footnote 8 in 2018. Table 2.5 presents the average uranium concentrations in treated effluent by metal mining sector. As shown in table 2.5, the uranium sector had an average uranium concentration of 0.0119 mg/L in 2018. Uranium mines have elevated natural uranium concentrations compared to other conventional mining operations. For context, action levels in the environmental code of practice range from 0.08 mg/L to 0.35 mg/L, and the Saskatchewan regulatory limit for uranium is 2.5 mg/L. CNSC staff continue to verify that releases of uranium are controlled and reduced to the extent practicable by reviewing effluent quality data, scrutinizing proposed facility changes that could affect effluent quality, and validating the effectiveness of the licensees’ programs to minimize the release of contaminants.
| Year | Metal mining sector | |||
|---|---|---|---|---|
| Uranium (mg/L) | Base metals (mg/L) | Precious metals (mg/L) |
Iron (mg/L) |
|
| 2017 | 0.0185* | 0.0062 | 0.0027 | 0.0002 |
| 2018 | 0.0119* | 0.0027 | 0.0010 | 0.0036 |
| 2019 | 0.0108 | 0.0026 | 0.0033 | 0.0019 |
| 2020 | 0.0092 | 0.0015 | 0.0027 | 0.0019 |
| 2021 | 0.0083 | 0.0029 | 0.0074 | 0.0017 |
*Data not available from Environment and Climate Change Canada; value calculated from licensee annual reports.
Uncontrolled releases
Licensees are required to report to the regulatory authorities, including the CNSC, any unauthorized releases (spills) of hazardous or radioactive substances to the environment.
Figure 2.10 shows the number of reportable environmental spills for uranium mine and mill facilities during the 2017 to 2021 reporting period. In each case, CNSC staff reviewed and evaluated the licensee’s actions to verify effective remediation and prevention and were satisfied with actions taken by the licensee. CNSC staff rated all 2021 spills as “low significance” resulting in no residual impact on the environment.
The facility-specific sections and appendix I describe each reportable spill and the licensee’s corrective actions. The CNSC’s spill rating definitions are found in appendix I‑2.
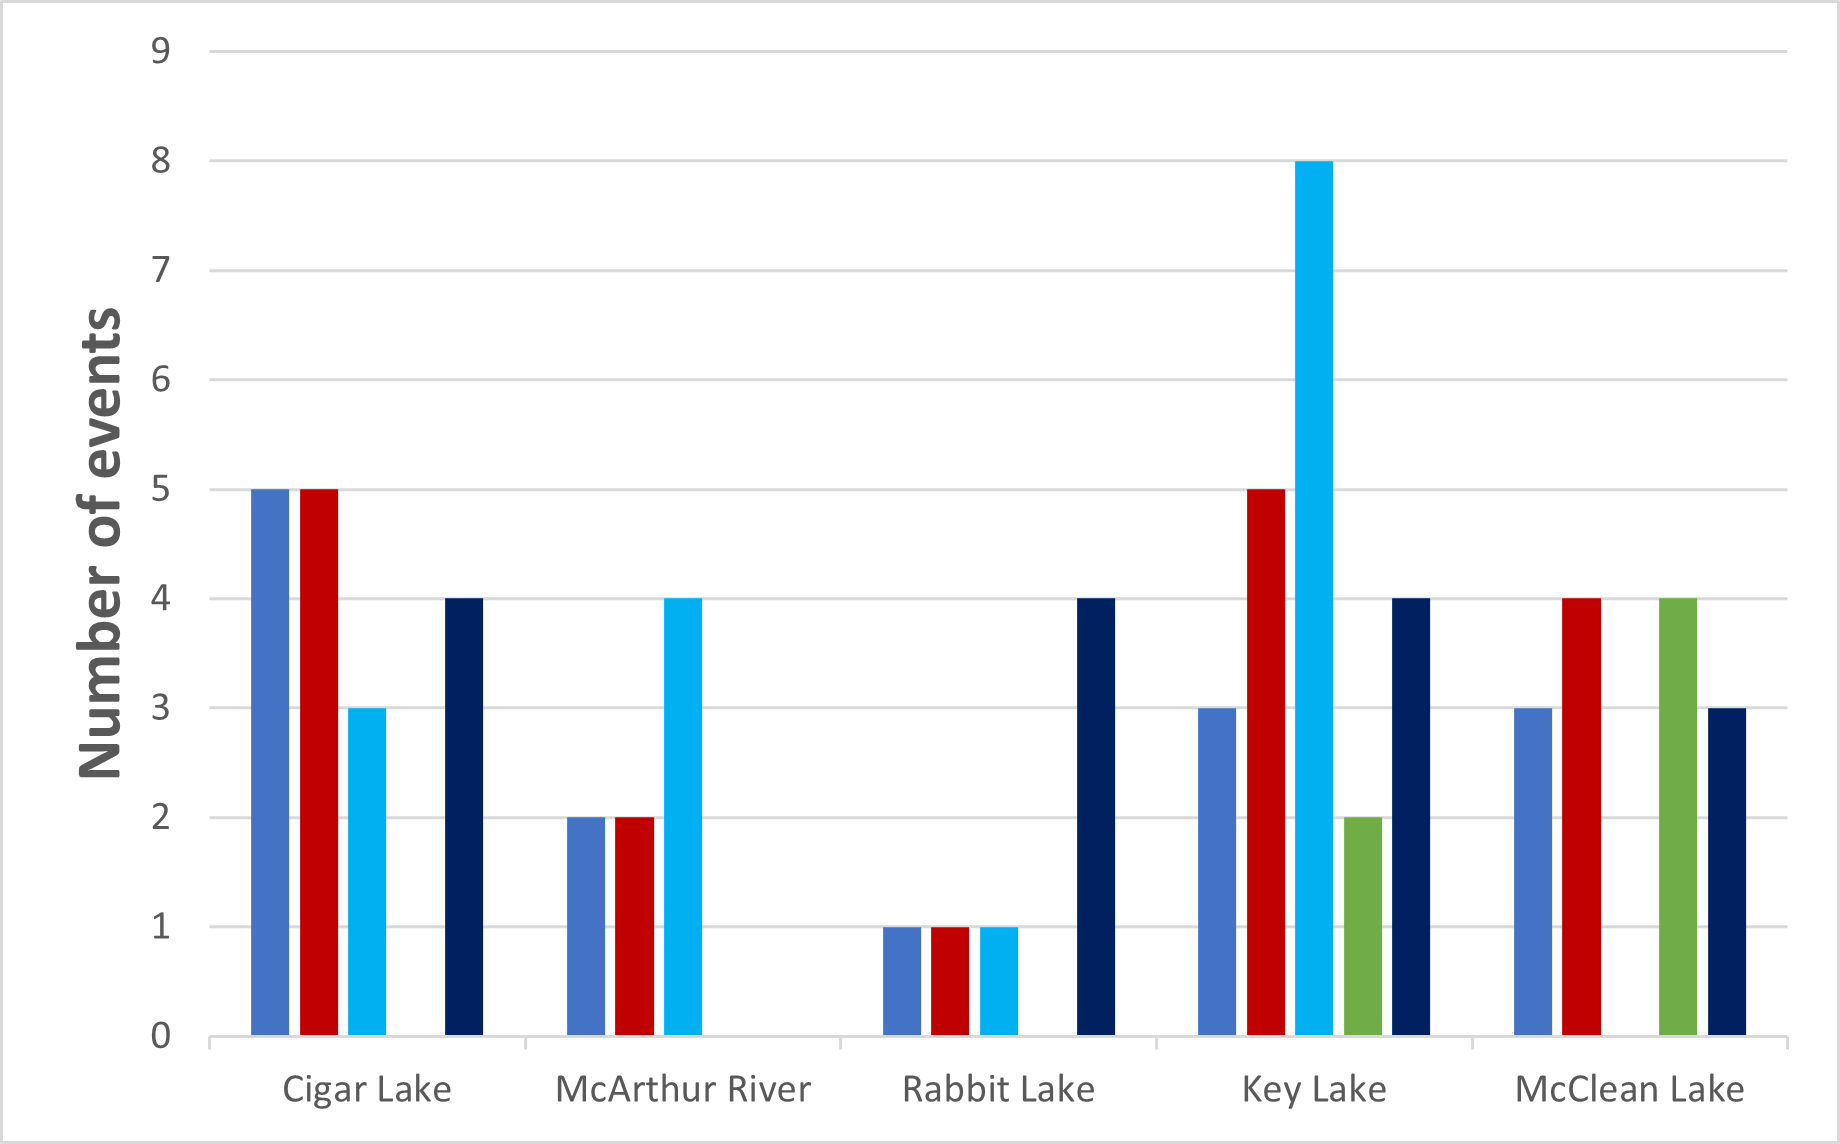
Figure 2.10: Text version
A graph showing the number of reportable environmental spills at uranium mines and mills from 2017 to 2021
| Cigar Lake | McArthur River | Rabbit Lake | Key Lake | McClean Lake | |
|---|---|---|---|---|---|
| 2017 | 5 | 2 | 1 | 3 | 3 |
| 2018 | 5 | 2 | 1 | 5 | 4 |
| 2019 | 3 | 4 | 1 | 8 | 0 |
| 2020 | 0 | 0 | 0 | 2 | 4 |
| 2021 | 4 | 0 | 4 | 4 | 5 |
Air emissions released to the environment
Environmental programs at uranium mines and mills include monitoring the effects of operations on the surrounding air and soil. Licensees measure airborne particulate levels and concentrations of regulated contaminants and COPCs, as well as the concentration of radon gas in ambient air. Soil and vegetation may be affected by atmospheric deposition of particulate containing adsorbed metals and radionuclides associated with onsite activities. Licensees monitor contaminant concentrations in soil and terrestrial vegetation to verify that operational impacts are below regulatory limits.
Facilities with milling operations monitor atmospheric emissions from acid plants, yellowcake dryers, calciner operations, packaging, grinding and ammonium sulphate operations. Other measured parameters (e.g., ambient radon and stack testing for sulphur dioxide, uranium and heavy metals) verify facility design and evaluate the operation’s performance against predictions made in ERAs.
CNSC staff verified that the mines and mills demonstrated satisfactory performance in mitigating and monitoring the effects of their operations on the surrounding air and soil. Soil monitoring results around the facilities indicated that all measured parameters are within background levels. As would be expected, air monitoring for radon gas near tailings management facilities and waste rock piles shows results higher than the regional background level of 25 Bq/m3. However, the concentrations fall to background levels within a short distance – less than 2 km from the facility. The monitoring results indicate negligible impacts to the environment from atmospheric releases and confirm that all uranium mines and mills are in compliance with their environmental programs and provincial standards.
2.3.3 Assessment and monitoring
In accordance with the Uranium Mines and Mills Regulations Footnote 11, each uranium mine and mill licensee has an environmental monitoring program that monitors concentrations of nuclear and hazardous substances in the environment, and characterizes and monitors effects to the environment associated with the licensed facility. Nuclear and hazardous substances associated with monitoring programs are selected based on regulated COPCs identified through the licensee’s ERA. COPCs identified through the ERA that have the potential for adverse environmental effects are managed through increased monitoring, inclusion in the environmental code of practice, and further study or implementation of additional controls by licensees. CNSC staff review and evaluate environmental monitoring programs as criteria for assessing environmental performance.
The results of a licensee’s environmental monitoring program relative to the ERA predictions are provided in an environmental performance report (EPR) that is typically completed every 5 years and provides environmental data collected over the previous 5-year period. CNSC staff and the Saskatchewan Ministry of Environment staff review the EPRs once these reports are released.
2.3.4 Environmental risk assessment
The CNSC uses facility-specific ERAs developed by licensees as a regulatory tool throughout the lifecycle of uranium mine and mill facilities. Applicants use ERAs during initial environmental assessments for new facilities and for changes to existing facilities or activities at licensed operations, where applicable. The ERA identifies the need for mitigation technologies or practices, and it predicts:
- physical disturbances
- releases to the atmosphere
- releases to surface water
- air quality
- soil and sediment quality
- surface water quality
- groundwater quality
- changes to the physical environment
- biological and human health effects
ERAs are reviewed at a minimum every 5 years and, if necessary, are updated. ERAs are updated based on changes to operational activities, revised predictions, environmental monitoring data collected over the previous 5 years, and the latest science. Table 2.6 shows the year of the most recent ERA submitted for each uranium mine and mill and the year the next ERA updates will be submitted to the CNSC for review. CNSC staff regularly review ERAs to determine the potential risks to human health and the environment and to verify that mitigation measures are adequate.
| Cigar Lake | McArthur River | Rabbit Lake | Key Lake | McClean Lake | |
|---|---|---|---|---|---|
| Current ERA | 2017 | 2020 | 2020 | 2020 | 2016 |
| Upcoming ERA | 2021 | 2025 | 2025 | 2025 | 2025* |
* Deferred to align environmental monitoring and reporting frequencies, subject to annual adequacy reviews, as approved by the CNSC on August 12, 2020.
2.3.5 Protection of people
Each licensee must demonstrate that persons are protected from exposures to radiological and hazardous substances released from an operation. Protection of people is assessed in the ERA, which contains a human health risk assessment (HHRA). The HHRA assesses hazardous and radiological releases from facilities, and it models the resultant concentrations of contaminants in air, water, soil and traditional foods (such as fish, waterfowl and moose). The concentrations of contaminants consumed by a typical local resident are assessed against human health benchmarks in the HHRA. For all facilities, the HHRAs confirm that the concentrations of contaminants for a typical local resident are well below concentrations that could cause health effects. Therefore, it has been determined that the health of persons in areas surrounding the facilities is protected.
Doses to persons are calculated based on an individual expected to have the highest possible exposure using conservative assumptions. Calculated dose values are determined for both camp workers (cook, for example) and persons that are expected to be in close vicinity to the licensed site (such as trappers and local residents). To be conservative, the dose calculations assume that local Indigenous residents (including adults, children and toddlers) obtain their dietary components throughout the year from the local area.
CNSC staff reviewed the HHRAs submitted by the uranium mines and mills and concluded that the estimated doses are a small fraction of the regulatory public dose limit of 1 mSv/year.
Eastern Athabasca Regional Monitoring Program
The Eastern Athabasca Regional Monitoring Program (EARMP) is a well‑recognized environmental monitoring program designed to gather data on long‑range environmental information and potential cumulative impacts downstream from uranium mining and milling operations. The program was initiated in 2011 with funding from the Saskatchewan government and the uranium mining industry (Cameco and Orano) as a sub-element of the Province of Saskatchewan's Boreal Watershed Initiative, which ended in 2017. The CNSC became a funding partner from 2017 to 2018 to support the publication of an EARMP final report (2011 to 2017), with a 5-year long-term funding agreement (2018–19 to 2022–23) signed in 2018 between the Government of Saskatchewan, the CNSC and industry. The community program monitors the safety of traditionally harvested country foods by analyzing water, fish, berries and wild meat (e.g., grouse, rabbit, caribou and moose) from representative northern Saskatchewan communities. The program contractor is an Indigenous‑owned business in northern Saskatchewan. Samples are collected from areas identified by community members, with members either assisting in sample collection or providing samples from their own harvesting activities.
Harvesting and consuming traditional country foods are an important part of the culture in northern Saskatchewan. The intent of the EARMP is to provide confidence and communicate transparently to community members that traditional country foods remain safe to eat today and in future generations. The program has demonstrated that concentrations of COPCs have been relatively consistent over time and are within the regional reference range, indicating no evidence of long‑range transport of contaminants associated with uranium mining.
Evaluation of country food data from previous years confirms that uranium mines and mills are not affecting the safety of country foods at nearby communities. The results indicated that radiological and non-radiological exposures to residents consuming country foods were similar to exposures of the general Canadian population. The EARMP has proven to be a productive means of involving the community in monitoring the health of their local environment and provides them with confidence in the safety of their traditional foods. The conclusion of the EARMP is that water and country foods are considered safe for consumption.
The annual reports and data are available on the EARMP website. The CNSC continues to support the EARMP, and CNSC staff are working to further collaborate on this valuable program.
Estimated dose to the public
Uranium mine and mill operations are located in remote areas, away from local populations. The Radiation Protection Regulations Footnote 5 set out a public radiation dose limit of 1 mSv per year above natural background radiation to ensure the protection of the public’s health.
Radiological exposures measured at the boundaries of these remote licensed facilities are close to measured background radiation levels.
In 2021, CNSC staff were satisfied that uranium mine and mill licensees controlled radiation doses to persons at levels well below the regulatory limits and kept doses ALARA. This conclusion was based on the outcome of inspections, as well as reviews of licensees’ radiation protection programs, radiological hazard control, worker dose control and application of the ALARA principle.
2.4 Conventional Health and Safety
Uranium mine and mill licensees in Canada are required to implement a conventional health and safety program that covers the management of workplace safety hazards and the protection of personnel and equipment.
For 2021, CNSC staff rated the conventional health and safety SCA at uranium mine and mill facilities as “satisfactory”, following acceptable performance in health and safety practices, awareness and performance.
| Cigar Lake | McArthur River | Rabbit Lake | Key Lake | McClean Lake |
|---|---|---|---|---|
| SA | SA | SA | SA | SA |
SA = satisfactory
Practices
The CNSC requires licensees to identify potential safety hazards, assess associated risks, and introduce the necessary materials, equipment, programs and procedures to effectively manage, control and minimize these risks. CNSC staff work in collaboration with the Saskatchewan Ministry of Labour Relations and Workplace Safety to provide regulatory oversight of conventional health and safety in uranium mines and mills. CNSC staff’s compliance verification activities include inspections and reviews of compliance reports and health and safety events.
CNSC staff confirmed that licensees at uranium mines and mills implemented effective conventional health and safety practices in their activities. In addition to CNSC staff’s regulatory oversight, the Saskatchewan government conducts regular inspections of occupational health and safety, mine safety and fire protection through an agreement with the Government of Canada.
Awareness
CNSC staff observed how the implementation of conventional health and safety programs continued to provide workers with education, training, tools and support (see figure 2.11). Each facility licensee promotes the idea that safety is the responsibility of all individuals; this message is reinforced by the licensees’ management, supervisors and workers. Licensee management stresses the importance of conventional health and safety through regular communication, management oversight and the continual improvement of safety systems. Through remote inspections, CNSC staff have identified a high level of communication and awareness in the area of conventional health and safety. CNSC staff concluded that in 2021, licensees of uranium mines and mills were committed to accident prevention and safety awareness and were focused on safety culture.
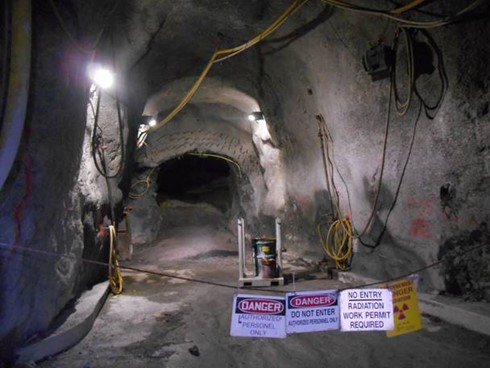
Source: CNSC
Performance
Key performance measurement criteria for conventional health and safety are the number of lost-time injuries (LTIs) and the total recordable incident rate (TRIR) at each facility. An LTI is a workplace injury that results in the worker being unable to return to work for a period of time. In reviewing each LTI, CNSC staff consider injury severity and frequency rates. The TRIR is the incident frequency rate, measuring the number of fatalities, LTIs and other injuries requiring medical treatment. Table 2.7 shows the number of LTIs at the uranium mines and mills, along with the severity and frequency rates and TRIRs.
| Cigar Lake | McArthur River | Rabbit Lake | Key Lake | McClean Lake | |
|---|---|---|---|---|---|
| Lost-time injuries1 | 2 | 0 | 0 | 0 | 3 |
| Severity rate2 | 6.31 | 0 | 0 | 0 | 49.8 |
| Frequency rate3 | 0.37 | 0 | 0 | 0 | 0.9 |
| Total recordable incident rate4 | 2.97 | 0.70 | 1.04 | 1.33 | 5.6 |
1 An injury that takes place at work and results in the worker being unable to return to work for a period of time.
2 A measure of the total number of days lost to injury for every 200,000 person-hours worked at the facility. Accident severity rate = [(# of days lost in last 12 months) / (# of hours worked in last 12 months)] x 200,000.
3 A measure of the number of LTIs for every 200,000 person-hours worked at the facility. Accident frequency rate = [(# of injuries in last 12 months) / (# of hours worked in last 12 months)] x 200,000.
4 A measure of the number of fatalities, LTIs and other injuries requiring medical treatment for every 200,000 person-hours worked at the facility.
Recordable incident rate = [(#incidents in last 12 months) / (# hours worked in last 12 months)] x 200,000.
Appendix K provides additional details on LTIs that occurred at the Cigar Lake Operation and the McClean Lake Operation in 2021 and the corrective actions taken. Information about these events can also be found in sections 3.4 and 7.4, respectively. CNSC staff and the Saskatchewan Ministry of Labour Relations and Workplace Safety monitor and review each reportable injury to verify that the cause is identified and that the corrective actions taken are satisfactory. When applicable, injury information is shared among the facilities for lessons learned to improve safety and prevent reoccurrences.
CNSC staff concluded through their compliance verification activities that the health and safety programs at all uranium mines and mills met regulatory requirements in 2021.
Lost-time injuries: Comparison of the uranium mining sector to other mining sectors in Saskatchewan
Table 2.8 displays the various safety statistics concerning mining sectors within Saskatchewan. Data for the uranium sector is presented both with and without contractor data because, while contractors are included in CNSC oversight as workers under the NSCA, contractor data is not available for the other sectors. The data indicates that the uranium mining and milling sector exhibits performance similar to other mining sectors for LTIs and frequency rate.
| Number of LTIs1 |
Accident frequency rate (200,000 person-hours)1 |
Accident severity rate (200,000 person-hours)1 |
Total recordable incident rate (200,000 person-hours)3 |
|
|---|---|---|---|---|
| Potash (underground) | 4 | 0.1 | 6.8 | 1.3 |
| Solution (potash) | 3 | 0.4 | 5.8 | 0.77 |
| Minerals (sodium sulphate, sodium chloride) | 2 | 0.7 | 2.5 | _ _ |
| Hard rock (gold, diamond) | 10 | 0.8 | 31.1 | 3.62 |
| Coal (strip mining) | 6 | 1.1 | 38.4 | 2.10 |
| Uranium | 2 | 0.08 | 8.5 | 1.74 |
| Uranium (including contractors)2 | 2 | 0.06 | 14.0 | 2.744 |
1Saskatchewan Ministry of Labour Relations and Workplace Safety.
2Statistics for all the other mining sectors do not include contractors.
3Saskatchewan Mining Association – data provided voluntarily by member companies.
4See tables 3.3, 4.3, 5.4, 6.3 and 7.3 for the data for each individual licensed uranium operation.
CNSC staff benchmarked the injury frequency rate at Saskatchewan uranium mines and mills against national and international mining statistics. The variation in definitions of a workplace injury is a limitation to consider when comparing safety-related statistics. However, where possible, efforts are made to compare and assess licensee performance against relevant national and international benchmarks. Table 2.9 shows various international benchmarks related to workplace incident frequency rates. The performance of the uranium mining and milling sector in Canada is similar.
| Publication/Standard | Lost-time frequency rate | Total recordable incident rate | Notes |
| Government of Western Australia Department of Mines, Industry Regulation and Safety1 | 2.3, 3.1 | N/A | Lost-time frequency rate of 2.3 across all mining sectors, and 3.1 in non-metal mining environments; rates are per million hours worked for 2016–17 |
| International Council on Mining and Metals2 | 4.3 | N/A | Average rate is per million hours worked for 2016 based on statistics from 27 of the largest international mining companies |
| 2017 Workplace Fatality and Injury Rate Report – Canada3 | 1.9 | N/A | Average rate across all Canadian provinces and territories per million hours worked |
| National Institute for Occupational Safety and Health4 (U.S.) | 1.7 | N/A | Average rate per 200,000 hours worked in 2015 |
| International Council on Mining and Metals (ICMM)5 | N/A | 3.94 | Total recordable injury frequency rate for ICMM members; rate per 200,000 hours worked in 2017 |
| International Council on Mining and Metals (ICMM)5 | N/A | 4.26 | Total recordable injury frequency rate for ICMM members; rate per 200,000 hours worked in 2016 |
| International Council on Mining and Metals (ICMM)5 | N/A | 4.70 | Total recordable injury frequency rate for ICMM members; rate per 200,000 hours worked in 2015 |
1 Safety Performance in the Western Australian Mineral Industry 2016–17, Government of Western Australia, Department of Mines, Industry Regulation and Safety, 2018.
2. Benchmarking 2016 Safety Data: Progress of ICMM Members, International Council on Mining and Metals.
3 2017 Workplace Fatality and Injury Rate, Tucker. S, University of Regina, 2017.
4 Number and rate of mining nonfatal lost-time injuries by year, 2006–15, National Institute for Occupational Safety and Health.
5 Benchmarking 2017 Safety Data: Progress of ICMM Members, International Council on Mining and Metals.
N/A = not available.
3 Cigar Lake Operation
Cameco Corporation (Cameco) is the operator of the Cigar Lake Operation, which is located approximately 660 kilometres north of Saskatoon, Saskatchewan.
The Cigar Lake Operation consists of an underground uranium mine with surface facilities for loading ore slurry into trucks, waste management facilities, a water treatment plant, surface freeze plants, administration offices and warehouses. Figure 3.1 shows an aerial view of the Cigar Lake Operation.
In June 2021, following a public hearing held virtually, the Commission issued a 10-year licence to Cameco for the Cigar Lake Operation. Cameco’s licence expires on June 30, 2031.
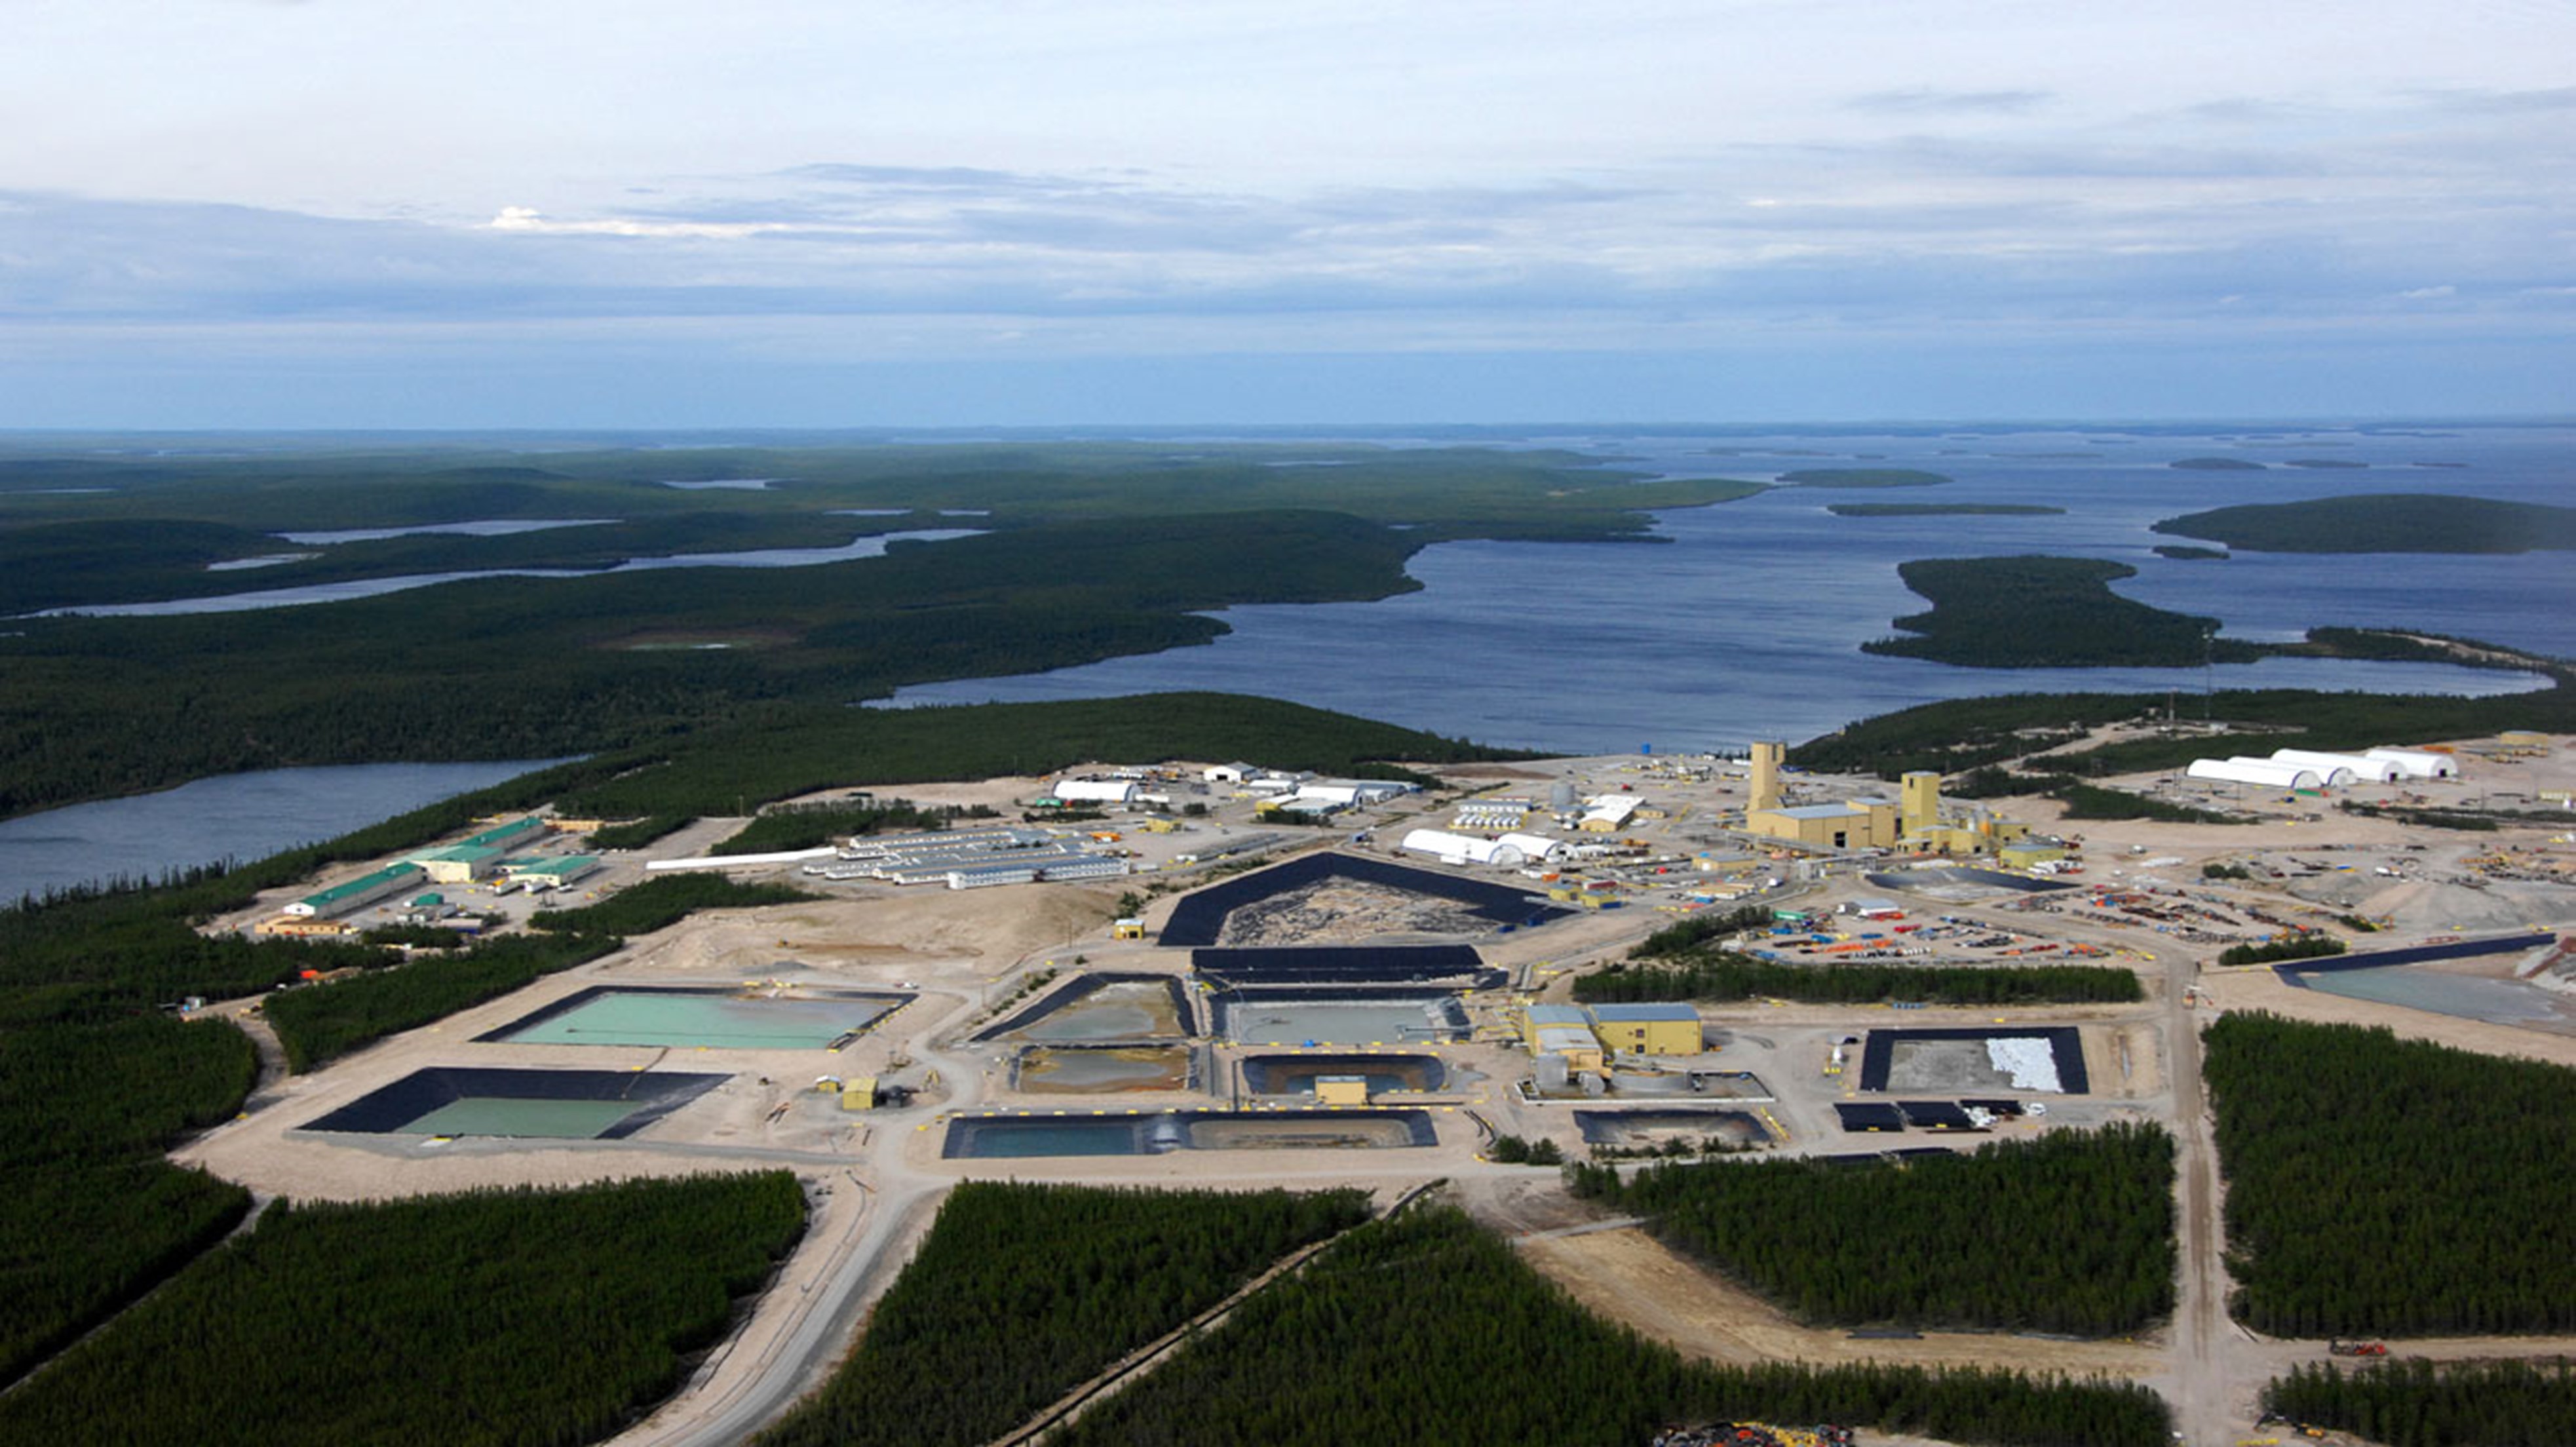
Source: Shaw Global
| Mining | 2017 | 2018 | 2019 | 2020 | 2021 |
|---|---|---|---|---|---|
| Ore tonnage (Mkg/year) | 36.49 | 43.06 | 46.09 | 24.6 | 34.3 |
| Average ore grade mined (% U) | 18.85 | 16.1 | 17.9 | 17.3 | 16.6 |
| Uranium mined (Mkg U/year) | 6.88 | 6.94 | 6.98 | 3.61 | 4.83 |
| Authorized annual production (Mkg U/year)* | 9.25 | 9.25 | 9.25 | 9.25 | 9.25 |
*Mining up to 7.0 Mkg of uranium per year, with a production flexibility up to 9.25 Mkg of uranium.
In 2021, production mining at Cigar Lake started in April and continued through the year. Cigar Lake is authorized to mine up to 7.0 MKg of uranium per year, with additional production flexibility to mine up to 9.25 MKg per year. CNSC staff confirmed that production at the Cigar Lake Operation remained within the authorized CNSC licence limit for the 2021 calendar year and that the facility has been carrying forward a cumulative production shortfall of 18.3 Mkg of uranium since 2013. This shortfall can be recouped in future years by increasing production in accordance with the production flexibility limits in the Cigar Lake LCH.
3.1 Performance
For 2021, CNSC staff rated all 14 SCAs for the Cigar Lake Operation as “satisfactory”. The SCA ratings for the 5‑year period from 2017 to 2021 are provided in appendix E.
In 2021, CNSC staff conducted 5 inspections that covered the following SCAs: management system, human performance management, operating performance, fitness for service, environmental protection, conventional health and safety, radiation protection, waste management, emergency management and fire protection, and packaging and transport.
There were 12 non-compliances identified through CNSC inspections at the Cigar Lake Operation for the 2021 calendar year. These non-compliances were of low risk and related to the management system; human performance management; operating performance; radiation protection, environmental protection; and emergency management and fire protection SCAs. Each non-compliance may be related to more than one SCA. For all non-compliances in 2021, corrective actions were implemented by the licensee, then reviewed and accepted by CNSC staff. A complete list of these inspections, including the dates the reports were sent to licensees and which SCAs assessed, can be found in appendix B.
3.2 Radiation protection
For 2021, CNSC staff continued to rate the radiation protection SCA at Cigar Lake as “satisfactory” based on regulatory oversight activities.
| 2017 | 2018 | 2019 | 2020 | 2021 |
|---|---|---|---|---|
| SA | SA | SA | SA | SA |
SA = satisfactory
Radiological hazard control
The main source of radiological exposure at the Cigar Lake Operation is from mining high-grade uranium ore. The effective dose contributors to nuclear energy workers (NEWs) at Cigar Lake remained similar to previous years: gamma radiation (46%), radon progeny (RnP34%) and long-lived radioactive dust (LLRD 20%). Less than 1% is attributed to radon gas (RnG). Gamma radiation hazards are controlled through the effective use of time, distance and shielding. Exposures to radon progeny, LLRD, and radon gas are controlled through source control, ventilation, contamination control and personal protective equipment.
Radiation protection program performance
CNSC staff confirmed that the radiation protection program and practices at the Cigar Lake Operation remained effective in controlling radiological exposure to workers. In November 2021, Cameco reported that a worker had an elevated personal alpha dosimeter result for September. The event resulted in an employee exceeding the weekly action level. Cameco’s response to the action level exceedance complied with subsection 6(2) of the Radiation Protection Regulations Footnote 5 and corrective actions were taken to verify the ongoing effectiveness of the radiation protection program. Further information on this reported event is included in appendix H.
Application of ALARA
In 2021, the collective radiation exposure to NEWs at the Cigar Lake Operation was 340.2 person-millisieverts (p-mSv). This value is similar to the 2020 value of 323.3 p-mSv.
Figure 3.2 illustrates the annual collective radiation exposures at the Cigar Lake Operation from 2017 to 2021.
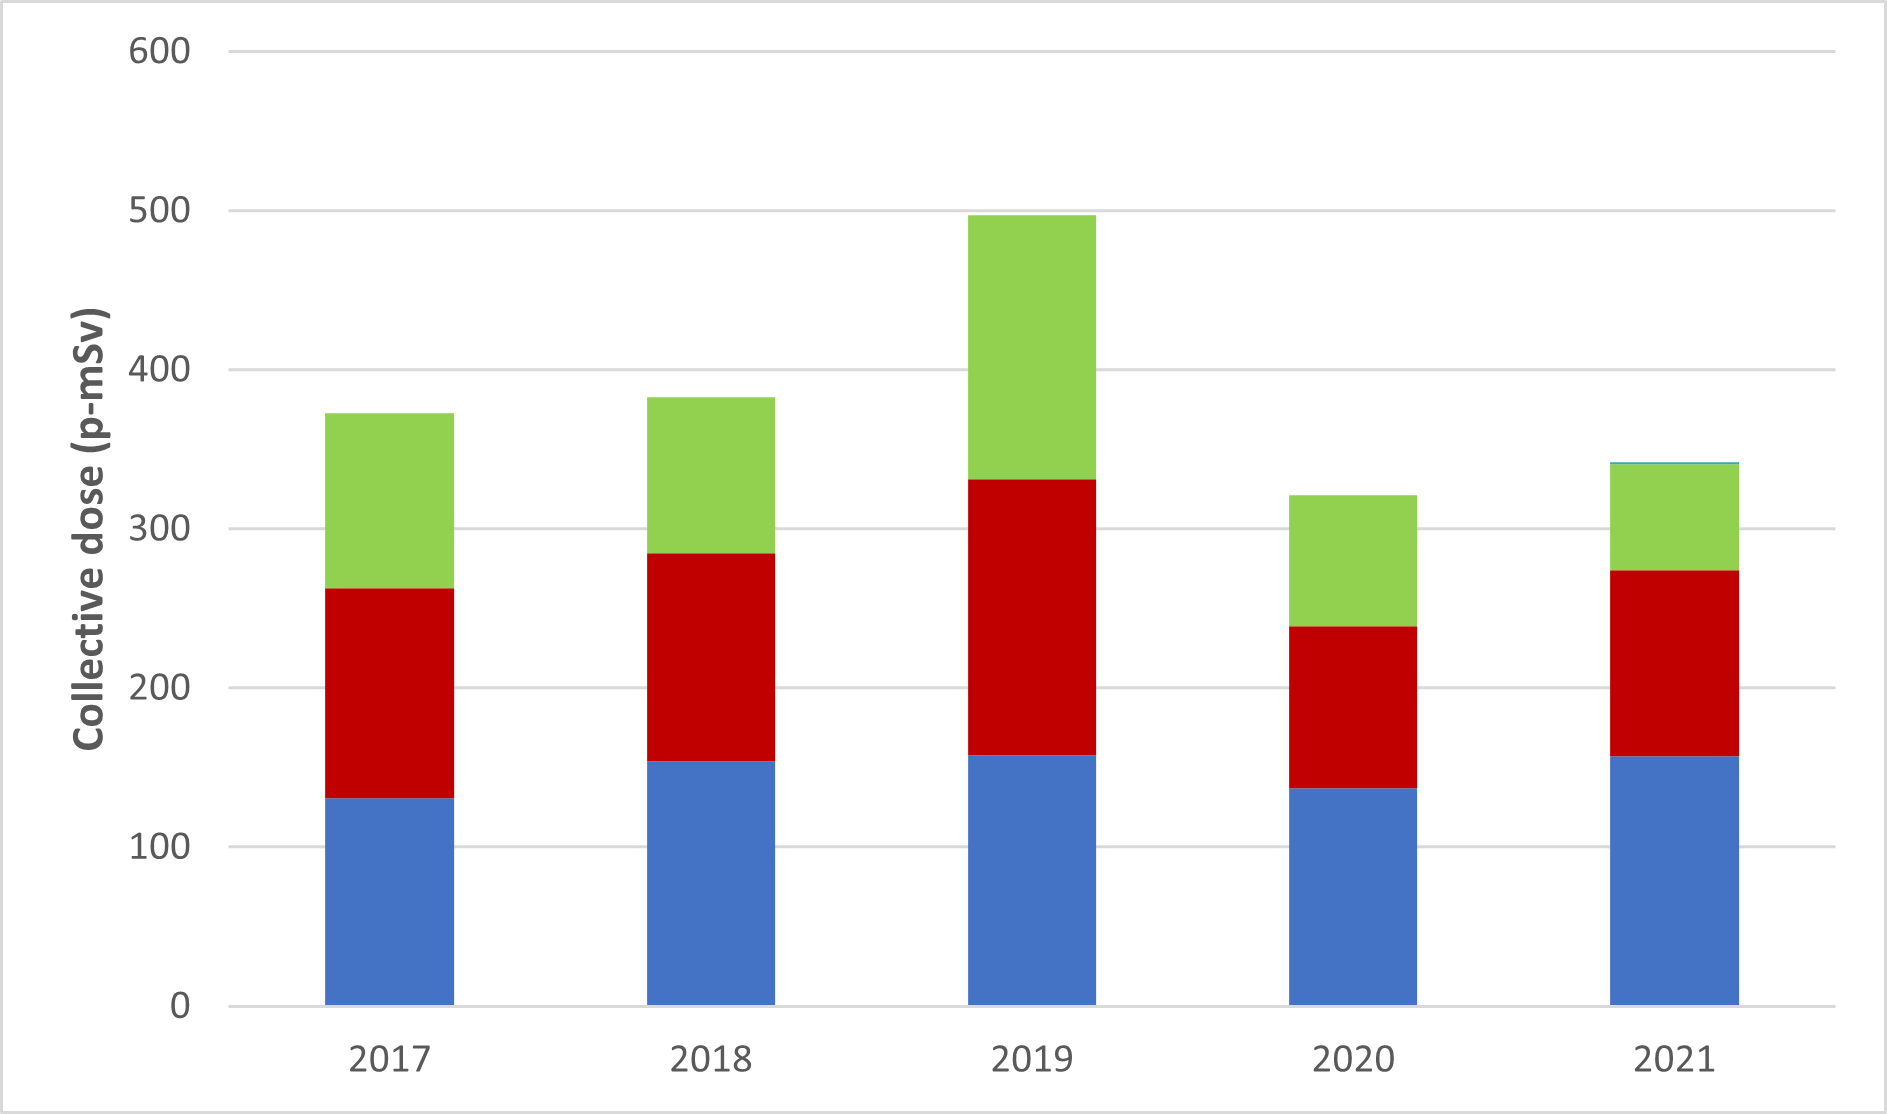
Figure 3.2: Text version
A graph showing the annual collective effective dose to nuclear energy workers at the Cigar Lake Operation from 2017 to 2021. The table shows the collective dose values to nuclear energy workers at the Cigar Lake Operation for the same period.
| 2017 | 2018 | 2019 | 2020 | 2021 | |
|---|---|---|---|---|---|
| Gamma (p-mSv) | 131 | 154 | 158 | 137 | 157 |
| RnP (p-mSv) | 132 | 131 | 173 | 102 | 117 |
| LLRD (p-mSv) | 110 | 98 | 166 | 82 | 67 |
| RnG (p-mSv) | 0 | 0 | 0 | 0 | 0 |
| Total* | 376 | 387 | 498 | 323 | 340 |
RnP = radon progeny; LLRD = long-lived radioactive dust; RnG = radon gas
* The total collective dose may not match the individual components due to rounding errors.
In 2021, Cameco continued the practice of identifying workers with the top 25 highest effective doses from the previous year and then working with both the supervisors and workers to reduce their effective dose. Using a pro-rated exposure value due to the partial year of production, 10 of the 25 workers were successful in reducing their total effective dose, while the remaining 15 were slightly above the pro-rated individual target. Staffing challenges related to COVID-19 were considered a factor in reaching the planned ALARA targets.
Worker dose control
In 2021, the average individual effective dose to NEWs was 0.32 mSv, compared to the average effective dose of 0.38 mSv in 2020. The maximum individual dose increased from 2.82 mSv in 2020 to 6.03 mSv in 2021, which is related to the action level discussed below. The 5-year dosimetry period of 2021 to 2025 has just started. So far, the maximum dose is 6.03 mSv (~6% of the regulatory dose limit of 100 mSv).
As indicated in figures 2.3 and 2.4 (section 2), no worker exceeded the regulatory individual effective dose limit of 50 mSv per 1-year dosimetry period. CNSC staff verified that the Cigar Lake Operation provided assurance that radiological hazards are anticipated and verified through suitable radiological monitoring by Cameco.
In November 2021, Cameco reported that a worker had exceeded the weekly action level of 1 mSv (appendix H). Cameco identified 4 corrective actions as a result of this event. CNSC staff reviewed the corrective actions and are satisfied with the actions taken.
Based on compliance verification activities that included inspections and the review of the licensee’s reports, work practices, monitoring results and individual effective dose results for 2021, CNSC staff were satisfied that the Cigar Lake Operation continued to be effective at controlling radiation doses to workers.
3.3 Environmental protection
For 2021, CNSC staff continued to rate the environmental protection SCA as “satisfactory”. CNSC staff concluded that the licensee’s environmental protection program was effectively implemented and met all regulatory requirements.
| 2017 | 2018 | 2019 | 2020 | 2021 |
|---|---|---|---|---|
| SA | SA | SA | SA | SA |
SA = satisfactory
Environmental management system
The environmental management system at the Cigar Lake Operation includes activities such as establishing annual environmental objectives, goals and targets. Cameco conducts internal audits of its environmental management program at the Cigar Lake Operation, as identified in the CNSC-approved management system program. CNSC staff reviewed and assessed the objectives, goals and targets through regular compliance verification activities. CNSC staff confirmed that Cameco continued to conduct routine inspections, internal audits, environmental training, and periodic reviews of environmental monitoring data. These activities were conducted to assess continual improvement and to confirm that the controls put in place to protect the environment are effective.
Effluent and emissions control
Treated effluent released to the environment
CNSC staff confirmed that constituent concentrations in treated effluent were low and remained below treated-effluent discharge limits at the Cigar Lake Operation. CNSC staff verified that treated effluent released to the environment was well below regulatory requirements. At the Cigar Lake Operation throughout 2021, concentrations for molybdenum, selenium and uranium (shown in figures 2.5 to 2.7) remained below their respective action levels and well below provincial licence effluent discharge limits.
The Cigar Lake Operation is required to monitor concentrations of other regulatory constituents and COPCs, such as radium-226, arsenic, copper, lead, nickel, zinc, total suspended solids (TSS) and pH. CNSC staff reviewed the Cigar Lake Operation effluent treatment concentrations and confirmed that it continued to meet MDMER Footnote 8 discharge limits (shown in section 2.3). There were no exceedances of the action levels in the environmental code of practice.
In 2016, the Cigar Lake Operation Environmental Performance Report (EPR) identified an increasing arsenic trend in effluent. While below regulatory limits, arsenic concentrations in the treated effluent were above environmental assessment predictions and above concentrations previously measured in the effluent prior to achieving full ore production. In response, Cameco created a working group to identify the causes of the elevated concentration and develop mitigation strategies. Cameco continues to implement several mitigation techniques to reduce arsenic loadings to the environment, such as improving the recycling of process water captured onsite for use in underground processes. As a result, arsenic loadings and mean concentrations have decreased. CNSC staff reviewed the 2016–20 EPR and the 2021 annual compliance report and noted that arsenic loadings and concentrations increased between 2016 and 2019 before decreasing in 2020 and 2021. For example, the arsenic loadings and mean concentrations were 23.4 kg and 0.065 mg/L in 2021 and 22.2 kg and 0.063 mg/L in 2020, compared to 33.4 kg and 0.095 mg/L in 2019. CNSC staff are satisfied that Cameco is taking appropriate actions to lower arsenic concentrations in the effluent.
CNSC staff will continue to review effluent quality results to verify that effluent treatment performance remains effective.
Air emissions released to the environment
As required by the CNSC, the Cigar Lake Operation maintains an air and terrestrial monitoring program. Air monitoring at the Cigar Lake facility includes ambient radon, total suspended particulate (TSP), soil sampling and lichen sampling to assess the impact of air emissions. Lichen samples are analyzed to determine the level of airborne particulate contaminants deposited on the surface of the lichen as a means of estimating the level of contamination, if any, entering lichen consumers, such as caribou.
Radon in ambient air is measured using passive track-etch cups at 8 monitoring stations around the operation. The background concentration of radon in northern Saskatchewan ranges from less than 7.4 Bq/m3 to 25 Bq/m3.
Figure 3.3 illustrates the average concentrations of radon in the air at the Cigar Lake Operation from 2017 to 2021 and shows that measured values are similar to values measured as northern Saskatchewan regional background. The average radon concentrations are less than the reference level of 60 Bq/m3, which represents an incremental dose of 1 mSv per year over background. CNSC staff noted that concentrations remained well below the reference level. It should be noted that 12 of the 15 sample points used for the 2021 average were below the detection limits.
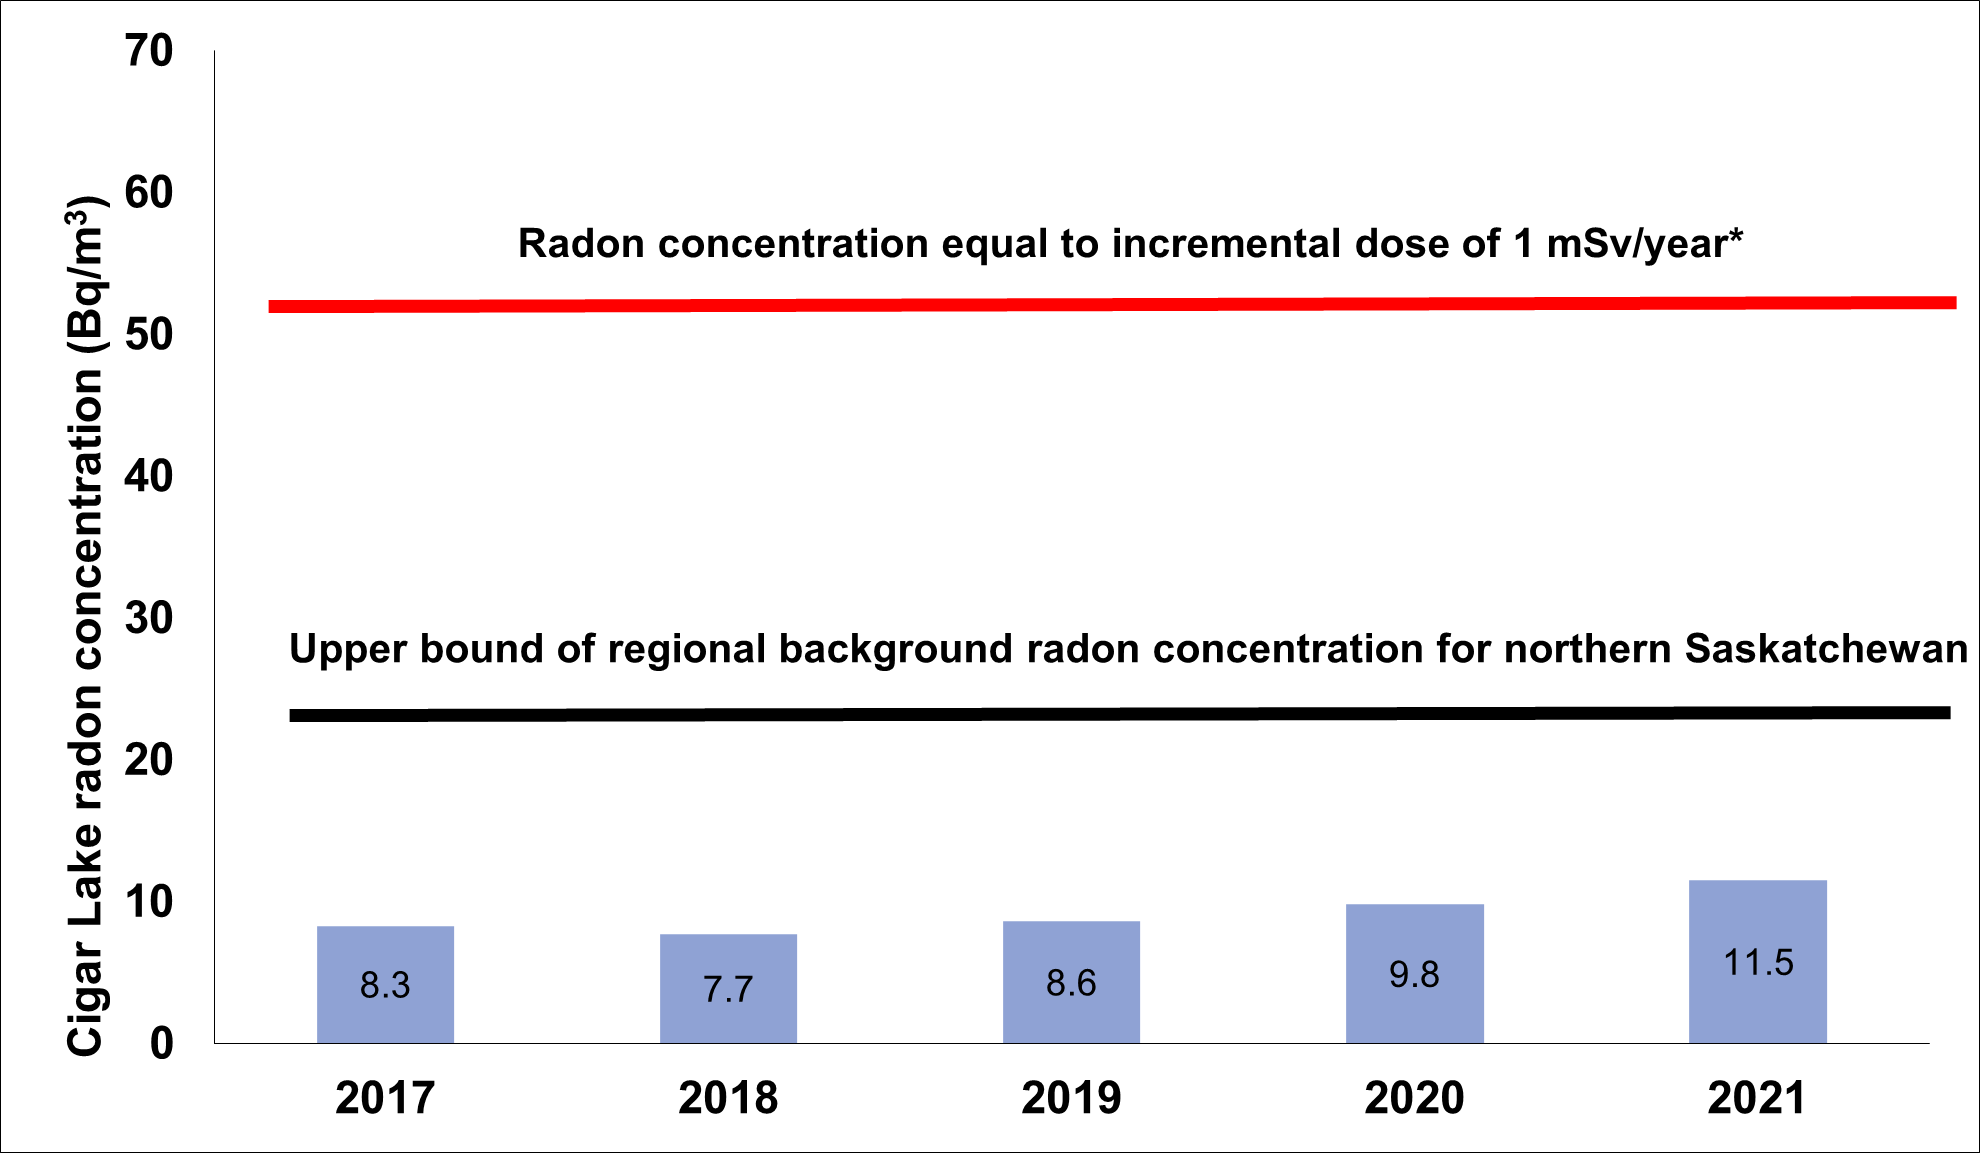
Figure 3.3: Text version
A graph showing the annual collective effective dose to nuclear energy workers at the Cigar Lake Operation from 2017 to 2021. The table shows the collective dose values to nuclear energy workers at the Cigar Lake Operation for the same period.
| 2017 | 2018 | 2019 | 2020 | 2021 | |
|---|---|---|---|---|---|
|
Radon concentrations (Bq/m3) |
8.3 | 7.7 | 8.6 | 9.8 | 11.5 |
* Upper bound of the incremental dose of 1 mSv per year above background (i.e., an incremental radon concentration of 30 Bq/m3 above natural background), based on International Commission on Radiological Protection (ICRP) Publication 115, Lung Cancer Risk from Radon and Progeny and Statement on Radon. Values are calculated as geometric means.
A high-volume air sampler was used to collect and measure TSP in air. Results showed that the TSP levels were lower than provincial standards (see table 3.2). In addition, the mean concentrations of metal and radionuclides adsorbed to TSP were low and were below the reference annual air quality levels identified in table 3.2.
| Parameter | Reference annual air quality levels | 2017 | 2018 | 2019 | 2020 | 2021 |
|---|---|---|---|---|---|---|
|
TSP (µg/m3) |
60 (3) | 30.3 | 18.9 | 19.9 | 8.9 | 23.5 |
|
As (µg/m3) |
0.06 (1) | 0.00039 | 0.00023 | 0.00026 | 0.00019 | 0.00029 |
|
Mo (µg/m3) |
23 (1) | 0.0002 | 0.0003 | 0.0002 | 0.0001 | 0.0003 |
|
Ni (µg/m3) |
0.04 (1) | 0.00103 | 0.00083 | 0.00060 | 0.00030 | 0.00062 |
|
Pb (µg/m3) |
0.10 (1) | 0.0008 | 0.0008 | 0.0007 | 0.0004 | 0.0005 |
|
Se (µg/m3) |
1.9 (1) | 0.00004 | 0.00003 | 0.00003 | 0.00002 | 0.00003 |
|
Pb-210 (Bq/m3) |
0.021 (2) | 0.00036 | 0.00037 | 0.00025 | 0.00031 | 0.00029 |
|
Po-210 (Bq/m3) |
0.028 (2) | 0.00012 | 0.00013 | 0.000089 | 0.000095 | 0.000096 |
|
Ra-226 (Bq/m3) |
0.013 (2) | 0.000031 | 0.000026 | 0.000013 | 0.000015 | 0.000017 |
|
Th-230
(Bq/m3) |
0.0085 (2) | 0.000023 | 0.000018 | 0.000009 | 0.000012 | 0.000014 |
|
U (µg/m3) |
0.06 (1) | 0.00151 | 0.00103 | 0.00096 | 0.00078 | 0.00082 |
1 Reference annual air quality levels are derived from Ontario’s 24-hour Ambient Air Quality Criteria (2012).
2 Reference level is derived from International Commission on Radiological Protection (ICRP) Publication 96, Protecting People Against Radiation Exposure in the Event of a Radiological Attack.
3 Saskatchewan Environmental Quality Guidelines, Table 20: Saskatchewan Ambient Air Quality Standards. Values are calculated as geometric means.
* Reference levels are based on Province of Ontario Ambient Air Quality Criteria and are shown for reference only. No federal or Saskatchewan provincial limits were established at the time of this report.
Soil and terrestrial vegetation may be affected by the atmospheric deposition of particulate, adsorbed metals and radionuclides associated with onsite activities. Lichen and soil samples were collected in 2019 as required under the triennial sampling program. COPC concentrations measured in the soil samples collected from the study area were comparable to historical results. Concentrations of metals remained below existing Canadian Environmental Quality Guidelines Footnote 12 set by the Canadian Council of Ministers of the Environment, and radionuclide concentrations were low and were near or at background levels and analytical detection limits. CNSC staff concluded that the level of airborne particulate contaminants produced by the Cigar Lake Operation is acceptable and does not pose a risk to the environment.
The lichen chemistry results from exposure stations in 2016 were similar to those of the reference stations and historical data. CNSC staff concluded that the level of airborne particulate contaminants was acceptable and did not pose a risk to lichen consumers.
Uncontrolled releases
In 2021, 4 events were reported in which hazardous substances were released to the environment at the Cigar Lake Operation. None of these events resulted in a residual impact to the environment. CNSC staff were satisfied with the licensee’s reporting of the releases and with the corrective actions taken. CNSC staff rate spills in accordance with the definitions provided in appendix I, table I-2. Figure 2.10 in section 2 displays the number of environmental reportable spills at the Cigar Lake Operation from 2017 to 2021.
Appendix I provides a brief description of reported spills, the corrective actions taken by the licensee, CNSC staff’s assessment of those actions and the significance ratings for 2021.
Assessment and monitoring
CNSC staff confirmed that the licensee, in accordance with the Cigar Lake environmental protection program, successfully carried out the required environmental monitoring.
Through the compliance verification activities conducted and the review of annual reports and EPRs, CNSC staff concluded that the environmental monitoring conducted at the Cigar Lake Operation met regulatory requirements. Consequently, CNSC staff concluded that the environment remained protected.
Environmental risk assessment
The CNSC uses environmental risk assessments (ERAs) to determine that people and the environment are protected. The Cigar Lake 2017 ERA submission indicated that, with the exception of arsenic, contaminant levels in the receiving water and sediment were within the predictions made in the 2011 environmental assessment. Although arsenic levels in Seru Bay of Waterbury Lake were above ERA predictions, they remained below the Saskatchewan Surface Water Quality Objectives of 5 µg/L. Cameco implemented measures to address arsenic in the effluent as noted above, and CNSC staff verified that arsenic loading to the environment remains below 2017 levels.
The Cigar Lake EPR and updated ERA for the period from 2011 to 2015 were submitted to the CNSC in 2016 and to the Saskatchewan Ministry of the Environment in 2017. CNSC staff reviewed the environmental monitoring results for air, soil, vegetation, surface water, groundwater, sediment and aquatic health indicators and confirmed that the results were within those predicted in the ERA.
After reviewing the EPR and ERA, CNSC staff concluded that adequate measures have been taken at the Cigar Lake Operation to protect the environment.
Protection of people
Cameco is required to demonstrate that the health and safety of the public are protected from exposures to hazardous substances released from the Cigar Lake Operation. The effluent and environmental monitoring programs currently conducted by the licensee are used to verify that releases of hazardous substances do not result in environmental concentrations that may affect public health.
The CNSC receives reports of discharges to the environment through the reporting requirements outlined in the licence and LCH. The review of the Cigar Lake Operation’s hazardous (non-radiological) discharges to the environment indicates that the public and the environment are protected. CNSC staff confirmed that environmental concentrations in the vicinity of the Cigar Lake Operation remained within those predicted in the 2017 ERA, and that human health remained protected.
Based on compliance verification activities that included inspections and the review of licensees’ reports, work practices and monitoring results for 2021, CNSC staff concluded that the Cigar Lake Operation’s environmental protection program continued to be effective at protecting the public and the environment.
3.4 Conventional health and safety
CNSC staff continued to rate the conventional health and safety SCA as “satisfactory” based on regulatory oversight activities conducted in 2021.
| 2017 | 2018 | 2019 | 2020 | 2021 |
|---|---|---|---|---|
| SA | SA | SA | SA | SA |
SA = satisfactory
Practices
CNSC staff monitored the implementation of the Cigar Lake Operation’s safety and health management program to verify the protection of workers. The program includes planned internal inspections, a safety permit system, occupational health and safety committees, training, and incident investigations. Cameco’s incident reporting system includes reporting, trending and investigation of near misses, which helps reduce future incidents that could cause injury.
Cigar Lake implemented the Safety Through Empowering Employee Leadership Committee. This safety steering committee is unique to the Cigar Lake Operation, as is the Good Catch reporting environment, through which facility staff are recognized for identifying near misses related to safety. These were found to be safety culture strengths at the Cigar Lake Operation.
CNSC staff verified that the conventional health and safety work practices and conditions at the Cigar Lake Operation continued to be effective in 2021.
Performance
Table 3.3 summarizes LTIs at the Cigar Lake Operation between 2017 and 2021. There were 2 LTIs at the Cigar Lake Operation in 2021. Events that occurred as a result of licensed operations were reported as required under section 29(1)(h) of the General Nuclear Safety and Control Regulations. The licensee identified the causes and took appropriate corrective actions.
The total recordable incident rate (TRIR) for Cigar Lake is included for the last 5 years. The TRIR is the incident frequency rate that measures the number of fatalities, LTIs and other injuries requiring medical treatment, per 200,000 person-hours worked.
| 2017 | 2018 | 2019 | 2020 | 2021 | |
|---|---|---|---|---|---|
| Lost-time injuries1 | 0 | 0 | 0 | 0 | 2 |
| Severity rate2 | 8.72 | 0 | 0 | 0 | 6.31 |
| Frequency rate3 | 0 | 0 | 0 | 0 | 0.37 |
| Total recordable incident rate4 | 1.58 | 1.00 | 1.67 | 2.08 | 2.97 |
1 An injury that takes place at work and results in the worker being unable to return to work for a period of time.
2 A measure of the total number of days lost to injury for every 200,000 person-hours worked at the facility. Accident severity rate = [(# of days lost in last 12 months) / (# of hours worked in last 12 months)] x 200,000.
3 A measure of the number of LTIs for every 200,000 person-hours worked at the facility. Accident frequency rate = [(# of injuries in last 12 months) / (# of hours worked in last 12 months)] x 200,000.
4 A measure of the number of fatalities, LTIs and other injuries requiring medical treatment for every 200,000 person-hours worked at the facility. Recordable incident rate = [(# of incidents in last 12 months) / (# of hours worked in last 12 months)] x 200,000.
Awareness
CNSC staff verified, through remote compliance activities, that Cameco had implemented effective controls to ensure that ongoing activities continued to be conducted safely in the face of any changes. CNSC staff confirmed that conventional health and safety events at the operation were investigated and that effective corrective actions were implemented. Managers, supervisors and workers share and promote the idea that safety is the responsibility of all individuals. The facility’s management stresses the importance of conventional health and safety through regular communication, management oversight and the continual improvement of safety systems.
CNSC staff’s compliance verification activities concluded that the Cigar Lake Operation’s health and safety program met regulatory requirements in 2021.
3.5 Additional SCAs
In addition to the 3 primary SCAs of radiation protection, environmental protection, and conventional health and safety, CNSC staff have provided a brief discussion of the additional SCAs; these are presented in the following sections.
3.5.1 Management system
The licensee includes program documentation for the management system SCA as part of the overall management system documents; these form part of the licensing basis for the Cigar Lake Operation in the LCH.
Although there were no inspections in 2021 at the Cigar Lake Operation that focused on evaluating the management system SCA, there were 2 notices of non‑compliance related to this SCA that resulted from general inspections. The management system SCA was also identified as applicable to the radiation protection action level exceedance reported in 2021. Appendix B contains information related to the inspection findings.
CNSC staff concluded that the licensee’s program in respect of this SCA remains satisfactory.
3.5.2 Human performance management
The licensee includes program documentation for the human performance management SCA as part of the overall management system documents; these form part of the licensing basis for the Cigar Lake Operation in the LCH.
In August 2021, a remote inspection that focused on personnel training was conducted to verify the implementation and effectiveness of Cameco’s human performance management at the Cigar Lake Operation. The inspection report outlined some deficiencies that resulted in 5 non-compliances related to training documentation and implementation (e.g., failure to identify positions requiring a systematic approach to training, out-of-date training documentation, and incomplete training change management process). Cameco provided an action plan to address these non-compliances. CNSC staff reviewed the plan and confirmed that Cameco’s actions were satisfactory to address the non-compliances in a timely manner. The human performance management SCA was also identified as applicable to the radiation protection action level reported in 2021.
CNSC staff concluded that the licensee’s program in respect of this SCA remains satisfactory.
3.5.3 Operating performance
The licensee includes program documentation for the operating performance SCA as part of the overall management system documents; these form part of the licensing basis for the Cigar Lake Operation in the LCH.
There were no inspections in 2021 at the Cigar Lake Operation that focused on evaluating the operating performance SCA. There were no notices of non‑compliance related to the operating performance SCA and no event reports for which this SCA was the main contributory factor.
CNSC staff concluded that the licensee’s program in respect of this SCA remains satisfactory.
3.5.4 Safety analysis
The licensee includes program documentation for the safety analysis SCA as part of the overall management system documents; these form part of the licensing basis for the Cigar Lake Operation in the LCH.
Although there were no inspections in 2021 at the Cigar Lake Operation that focused on evaluating the safety analysis SCA, there was 1 notice of non-compliance related to this SCA that resulted from a general inspection. There were no event reports for which this SCA was the main contributory factor.
CNSC staff concluded that the licensee’s program in respect of this SCA remains satisfactory.
3.5.5 Physical design
The licensee includes program documentation for the physical design SCA as part of the overall management system documents; these form part of the licensing basis for the Cigar Lake Operation in the LCH.
There were no inspections in 2021 at the Cigar Lake Operation that focused on evaluating the physical design SCA. There were no notices of non-compliance related to the physical design SCA and no event reports for which this SCA was the main contributory factor.
CNSC staff concluded that the licensee’s program in respect of this SCA remains satisfactory.
3.5.6 Fitness for service
The licensee includes program documentation for the fitness for service SCA as part of the overall management system documents; these form part of the licensing basis for the Cigar Lake Operation in the LCH.
There was 1 inspection in 2021 at the Cigar Lake Operation that focused on evaluating the fitness for service SCA, and 1 notice of non-compliance related to this SCA was issued. There were no event reports for which this SCA was the main contributory factor.
CNSC staff concluded that the licensee’s program in respect of this SCA remains satisfactory.
3.5.7 Emergency management and fire protection
The licensee includes program documentation for the emergency management and fire protection SCA as part of the overall management system documents; these form part of the licensing basis for the Cigar Lake Operation in the LCH.
There was 1 inspection in 2021 at the Cigar Lake Operation that focused on evaluating the emergency management and fire protection SCA, and 1 notice of non-compliance related to this SCA was issued. There were no event reports for which this SCA was the main contributory factor.
CNSC staff concluded that the licensee’s program in respect of this SCA remains satisfactory.
3.5.8 Waste management
The licensee includes program documentation for the waste management SCA as part of the overall management system documents; these form part of the licensing basis for the Cigar Lake Operation in the LCH.
There were no inspections in 2021 at the Cigar Lake Operation that focused on evaluating the waste management SCA. There were no notices of non-compliance related to the waste management SCA and no event reports for which this SCA was the main contributory factor.
CNSC staff concluded that the licensee’s program in respect of this SCA remains satisfactory.
3.5.9 Security
The licensee includes program documentation for the security SCA as part of the overall management system documents; these form part of the licensing basis for the Cigar Lake Operation in the LCH.
There were no inspections in 2021 at the Cigar Lake Operation that focused on evaluating the security SCA. There were no notices of non-compliance related to the security SCA and no event reports for which this SCA was the main contributory factor.
CNSC staff concluded that the licensee’s program in respect of this SCA remains satisfactory.
3.5.10 Safeguards and non-proliferation
The licensee includes program documentation for the safeguards and non‑proliferation SCA as part of the overall management system documents; these form part of the licensing basis for the Cigar Lake Operation in the LCH.
There were no inspections in 2021 at the Cigar Lake Operation that focused on evaluating the safeguards and non-proliferation SCA. There were no notices of non-compliance related to the safeguards and non-proliferation SCA and no event reports for which this SCA was the main contributory factor.
In addition to CNSC compliance activities relating to the specific areas under the safeguards and non-proliferation SCA, the International Atomic Energy Agency (IAEA) conducts independent inspections, with coordination and support provided through the CNSC regulatory framework. No IAEA inspections were conducted at the Cigar Lake Operation in 2021.
CNSC staff concluded that the licensee’s program in respect of this SCA remains satisfactory.
3.5.11 Packaging and transport
The licensee includes program documentation for the packaging and transport SCA as part of the overall management system documents; these form part of the licensing basis for the Cigar Lake Operation in the LCH.
There were no inspections in 2021 at the Cigar Lake Operation that focused on evaluating the packaging and transport SCA. There were no notices of non-compliance related to the packaging and transport SCA and no event reports for which this SCA was the main contributory factor.
CNSC staff concluded that the licensee’s program in respect of this SCA remains satisfactory.
4 McArthur River Operation
Cameco Corporation (Cameco) is the operator of the McArthur River mine, which is located approximately 620 kilometres north of Saskatoon, Saskatchewan.
The McArthur River Operation consists of an underground uranium mine, primary ore processing, ore slurry loading, waste management facilities, a water treatment plant, effluent storage ponds, surface freeze plants, administration offices and warehouses (see figure 4.1).
In October 2013, following a public hearing in La Ronge, Saskatchewan, the Commission issued a 10-year licence to Cameco for the McArthur River Operation. Cameco’s licence expires on October 31, 2023.
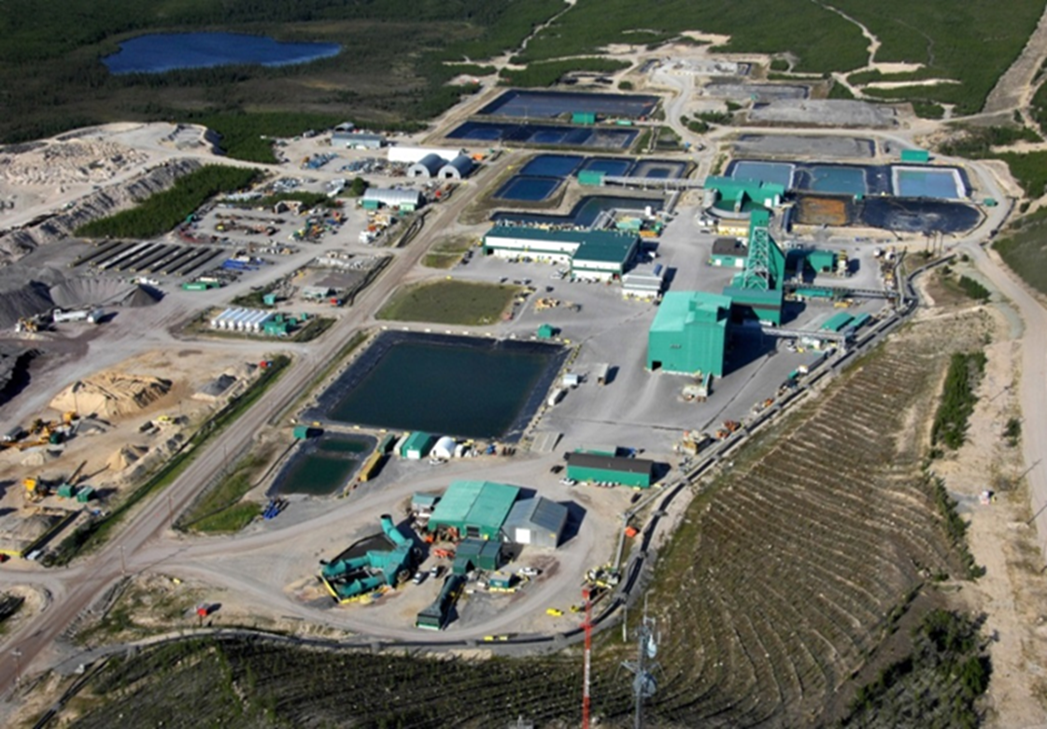
Source: Cameco
In 2018, the McArthur River Operation halted active mining, and the mining facility was placed in safe care and maintenance. In 2022, Cameco indicated its intent to begin the process of transitioning the McArthur River Operation from care and maintenance to production. This will be reflected in next year’s regulatory oversight report. Mining production data from 2017 to 2021 for the McArthur River Operation is provided in table 4.1.
| Mining | 2017 | 2018 | 2019 | 2020 | 2021 |
|---|---|---|---|---|---|
| Ore tonnage (Mkg/year) | 91.44 | 2.79 | 0 | 0 | 0 |
| Average ore grade mined (% U) | 7.09 | 6.42 | N/A | N/A | N/A |
| Uranium mined (Mkg U/year) | 6.48 | 0.18 | N/A | N/A | N/A |
| Authorized annual production (Mkg U/year) | 9.6 | 9.6 | 9.6 | 9.6 | 9.6 |
N/A = not applicable.
4.1 Performance
The SCA ratings at the McArthur River Operation for the 5-year period from 2017 to 2021 are shown in appendix E. For 2021, CNSC staff rated all SCAs as “satisfactory”.
In 2021, CNSC staff carried out 2 inspections to evaluate the following SCAs: environmental protection, conventional health and safety, radiation protection, human performance management, and emergency management and fire protection.
There was 1 instance of non-compliance identified during CNSC inspections at the McArthur River Operation in 2021. The non-compliance was of low risk and was related to the updating of work instructions on site evacuation within the emergency management SCA. The licensee implemented corrective actions, which were reviewed and accepted by CNSC staff. A complete list of inspections can be found in appendix B.
4.2 Radiation protection
For 2021, CNSC staff continued to rate the radiation protection SCA as “satisfactory”, based on regulatory oversight activities.
| 2017 | 2018 | 2019 | 2020 | 2021 |
|---|---|---|---|---|
| SA | SA | SA | SA | SA |
SA = satisfactory
Cameco includes program documentation for the radiation protection SCA as part of the overall management system documents; these form part of the licensing basis in the LCH.
There were no exceedances of the regulatory dose limit and no exceedances of the weekly and quarterly action levels. There were 2 inspections conducted at the McArthur River Operation that focused on evaluating compliance with the radiation protection SCA. There were no event reports for which this SCA was the contributory factor.
Radiological hazard control
In 2021, the radiation dose to NEWs at the McArthur River Operation was contributed by radon progeny (59%), gamma radiation (26%) and LLRD (15%). This distribution is similar to that in the previous year during which the mine was also in care and maintenance. Exposures to radon progeny, radon gas and LLRD are managed through source control, ventilation, contamination control and personal protective equipment. Gamma radiation hazards are controlled through practices that involve the effective use of time, distance and shielding.
Radiation protection program performance
In 2021, CNSC staff were satisfied that the radiation protection program and practices at the McArthur River Operation remained effective at controlling radiological exposure to workers. The doses to workers remained below regulatory limits and ALARA. There were no exceedances of regulatory limits or action levels at the McArthur River Operation in 2021.
Application of ALARA
In 2021, the collective dose to NEWs at the McArthur River Operation was 83 p‑mSv. The reduction in the collective dose reflects the state of care and maintenance of the facility over the last 3 years.
The ALARA focus at the McArthur River Operation was on radiation training during this period of reduced staff and care and maintenance activities.
Figure 4.2 displays the annual collective radiation exposures at the McArthur Operation from 2017 to 2021.
Figure 4.2: McArthur River Operation – Annual collective dose, 2017–21
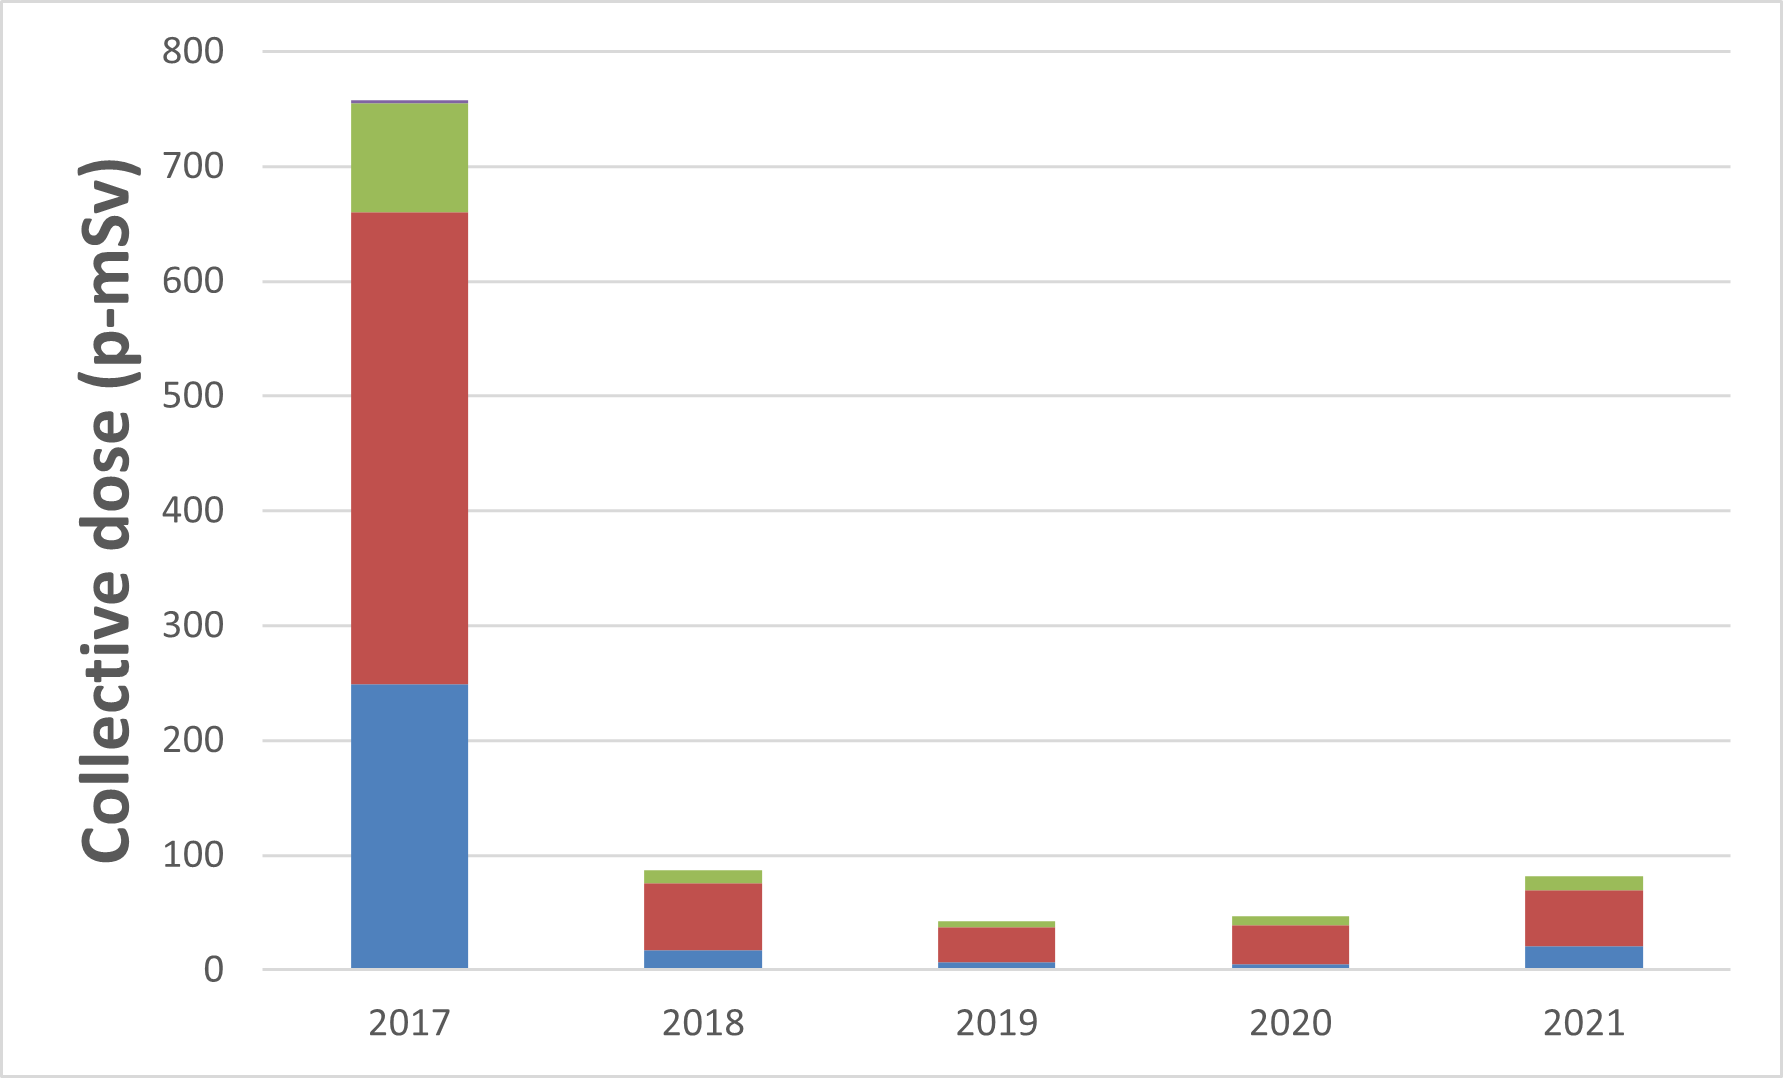
Figure 4.2: Text version
A graph showing the annual collective effective dose to nuclear energy workers at the McArthur River Operation from 2017 to 2021. The table shows the collective dose values to nuclear energy workers at the McArthur River Operation for the same period.
| 2017 | 2018 | 2019 | 2020 | 2021 | |
|---|---|---|---|---|---|
|
Gamma (p-mSv) |
249 | 17 | 7 | 5 | 21 |
|
RnP
(p-mSv) |
411 | 59 | 30 | 34 | 49 |
|
LLRD (p-mSv) |
95 | 11 | 6 | 8 | 12 |
|
RnG
(p-mSv) |
3 | 0 | 0 | 0 | 0 |
| Total* | 756 | 88 | 44 | 47 | 82 |
RnP = radon progeny; LLRD = long-lived radioactive dust; RnG = radon gas
* The total collective dose may not match the individual components due to rounding errors.
Worker dose control
The average individual effective dose to NEWs was 0.25 mSv. The maximum individual effective dose of 3.06 mSv was assigned to an underground support worker. The 2021 values are comparable to those from the previous year. All individual effective doses were well below the annual regulatory limit of 50 mSv, as indicated in figures 2.3 and 2.4 (section 2). The 5-year dosimetry period of 2021 to 2025 has just started. So far, the maximum dose is 3.06 mSv (~3.1% of the 100 mSv dose limit).
Based on compliance verification activities, such as inspections and the review of the licensee’s reports, work practices, monitoring results and individual effective dose results, CNSC staff were satisfied that the radiation dose to workers continued to be effectively controlled at the McArthur River Operation in 2021.
4.3 Environmental protection
For 2021, CNSC staff continued to rate the environmental protection SCA as “satisfactory” based on regulatory oversight activities. CNSC staff verified that the environmental protection program was effectively implemented and met all regulatory requirements.
| 2017 | 2018 | 2019 | 2020 | 2021 |
|---|---|---|---|---|
| SA | SA | SA | SA | SA |
SA = satisfactory
Cameco includes program documentation for the environmental protection SCA as part of the overall management system documents; these form part of the licensing basis in the LCH.
There was 1 inspection in 2021 at the McArthur River Operation that focused on evaluating the environmental protection SCA. No issues were found during the inspection and there were no event reports for which this SCA was the main contributing factor.
Environmental management system
The environmental management system at the McArthur River Operation includes activities such as establishing annual environmental objectives, goals and targets. Cameco conducts internal audits of its environmental management program at the McArthur River Operation, as identified in its CNSC-approved management system program. CNSC staff reviewed and assessed the objectives, goals and targets through regular compliance verification activities. CNSC staff noted that Cameco continued to carry out routine inspections, internal audits, environmental training, and periodic reviews of environmental monitoring data. These activities were conducted to verify continual improvement and to confirm that the controls put in place to protect the environment are effective.
Effluent and emissions control
Treated effluent released to the environment
CNSC staff verified that treated effluent released to the environment was below regulatory requirements and has remained stable or has improved over the past 5 years. As discussed in section 2.3, the constituents of potential concern (COPCs) in treated effluent at uranium mine and mill operations with the potential to adversely affect the environment are molybdenum, selenium and uranium (figures 2.5, 2.6 and 2.7, respectively). Of the 3 COPCs, molybdenum posed an elevated risk at the McArthur River Operation. In response, Cameco implemented process changes prior to 2018 during active mining, which reduced molybdenum concentrations in treated effluent. Since 2018, concentrations of molybdenum have been further reduced by approximately 90% as a result of the facility’s placement in a state of care and maintenance.
Cameco analyzed treated effluent from the McArthur River Operation for other constituents, such as radium-226, arsenic, copper, lead, nickel, zinc, total suspended solids (TSS) and pH, for which limits are defined in the CNSC-issued McArthur River licence; those limits mirror the limits defined in the MDMER Footnote 8 (section 2.3). CNSC staff reviewed the effluent treatment concentrations and confirmed that the McArthur River Operation continued to meet the discharge limits.
The CNSC will continue to review effluent quality results to verify that effluent treatment performance remains effective.
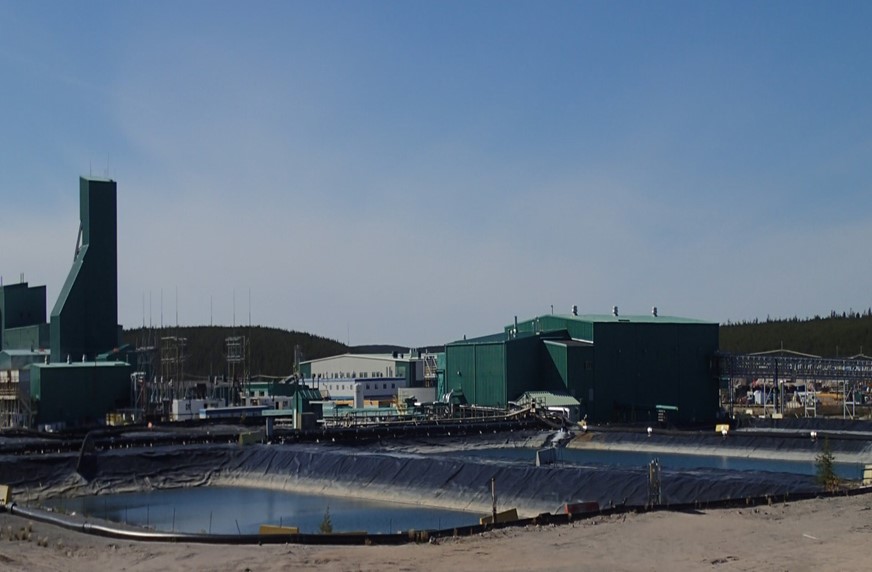
Source: Cameco
Air emissions released to the environment
The CNSC requires that Cameco maintain an air and terrestrial monitoring program at its McArthur River Operation. Air and terrestrial monitoring at the McArthur River facility includes ambient radon, total suspended particulate (TSP), soil sampling and lichen sampling to assess the impact of air emissions. An analysis of blueberry chemistry was also included to align with country food studies. Blueberry twigs are monitored to determine whether soil-borne contaminants (when present) are being absorbed through the roots into the growing plant parts. The monitoring of soil and blueberry stems/twigs was completed in the summer of 2018. The results are within the historical range for the stations sampled.
Radon in ambient air is monitored using passive track-etch cups at 10 monitoring stations surrounding the operation. Figure 4.4 shows that the average concentrations of radon in ambient air from 2017 to 2021 were similar to past performance, with radon concentrations typical of the northern Saskatchewan regional background of less than 7.4 Bq/m3 to 25 Bq/m3. The average radon concentrations were less than the reference level of 60 Bq/m3, which represents an incremental dose of 1 mSv/year above background.
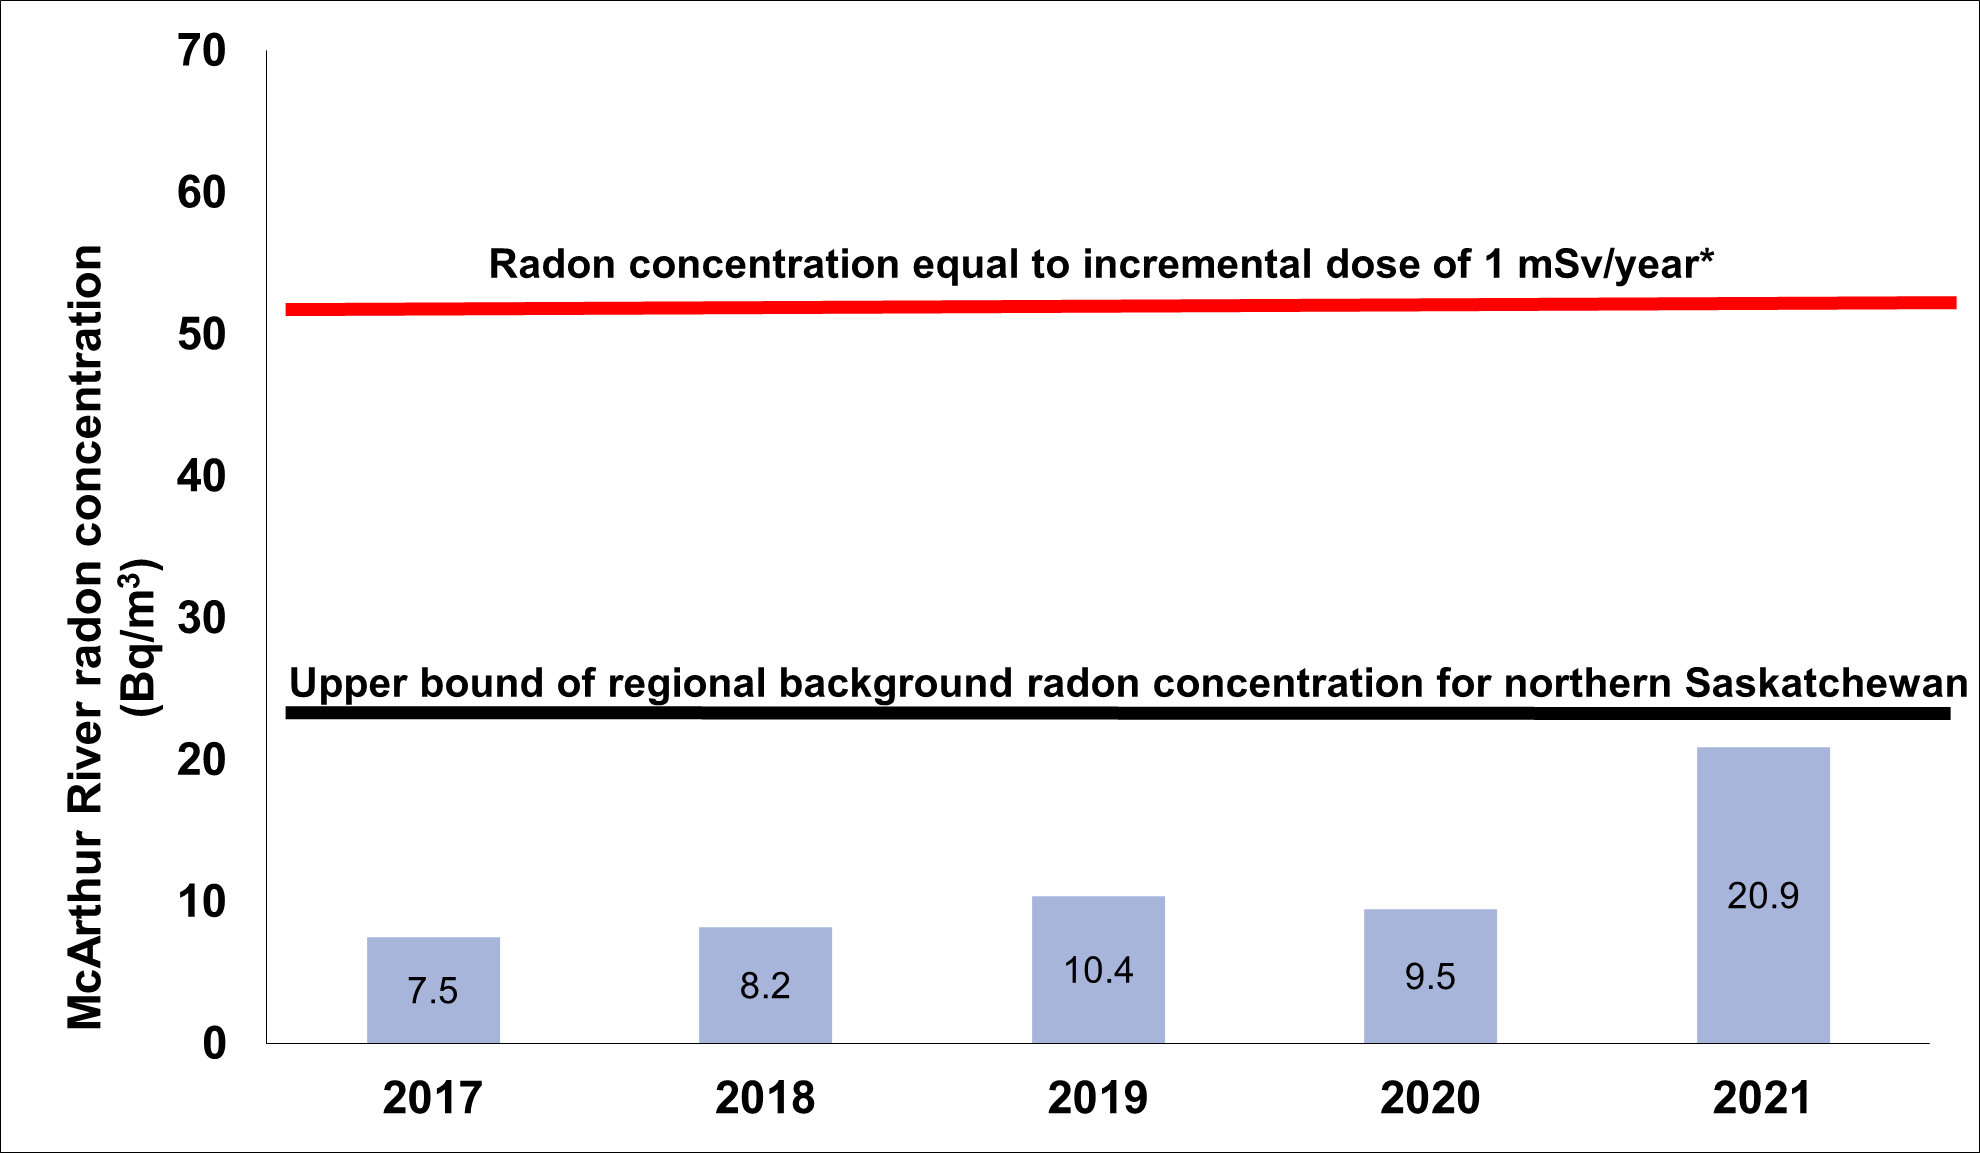
Figure 4.4: Text version
A graph showing the average concentration of radon gas in ambient air at the McArthur River Operation from 2017 to 2021. The upper bound of regional background radon concentration for Northern Saskatchewan is 25 Becquerels per meter cubed. The radon concentration equal to an incremental dose of 1 millisievert per year is 55 Becquerels per meter cubed.
| 2017 | 2018 | 2019 | 2020 | 2021 | |
|
Radon concentrations (Bq/m3) |
7.5 | 8.2 | 10.4 | 9.5 | 20.9 |
* Upper bound of the incremental dose of 1 mSv per year above background (i.e., an incremental radon concentration of 30 Bq/m3 above natural background), based on International Commission on Radiological Protection (ICRP) Publication 115, Lung Cancer Risk from Radon and Progeny and Statement on Radon. Values are calculated as geometric means.
** Part of change in value attributed to differing detection limit and laboratory preforming analysis.
Two high-volume air samplers were used to collect and measure TSP in air. Taking the average of the 2 stations, the TSP levels were lower than provincial standards (see table 4.2). In addition, the mean concentrations of metal and radionuclides adsorbed to TSP were low and were below the reference annual air quality levels identified in table 4.2.
| Parameter | Reference annual air quality levels | 2017 | 2018 | 2019 | 2020 | 2021 |
|---|---|---|---|---|---|---|
| TSP (µg/m3) | 60 (3) | 3.24 | 1.69 | 2.5 | 1.31 | 2.21 |
| As (µg/m3) | 0.06 (1) | 0.0001 | 0.00006 | 0.00004 | 0.00005 | 0.00005 |
| Cu (µg/m3) | 9.6 (1) | 0.0064 | 0.0072 | 0.0063 | 0.0042 | 0.007 |
| Ni (µg/m3) | 0.04 (1) | 0.0007 | 0.0006 | 0.00054 | 0.00049 | 0.00064 |
| Pb (µg/m3) | 0.10 (1) | 0.0006 | 0.0008 | 0.00063 | 0.00046 | 0.00419 |
| Se (µg/m3) | 1.9 (1) | 0.00004 | 0.00003 | 0.000025 | 0.0000025 | 0.00003 |
| Zn (µg/m3) | 23 (1) | 0.0084 | 0.0295 | 0.023 | 0.010 | 0.00608 |
| Pb-210 (Bq/m3) | 0.021 (2) | 0.0004 | 0.0003 | 0.0003 | 0.0003 | 0.0003 |
| Po-210 (Bq/m3) | 0.028 (2) | 0.0001 | 0.0001 | 0.0001 | 0.0001 | 0.00009 |
| Ra-226 (Bq/m3) | 0.013 (2) | 0.00001 | 0.00001 | 0.000006 | 0.0000044 | 0.000004 |
| Th-230 (Bq/m3) | 0.0085 (2) | 0.000007 | 0.00001 | 0.000008 | 0.000008 | 0.000008 |
| U (µg/m3) | 0.06 (1) | 0.0003 | 0.0001 | 0.0001 | 0.0001 | 0.000085 |
1 Reference annual air quality levels are derived from Ontario’s 24-hour Ambient Air Quality Criteria (2012).
2 Reference level is derived from International Commission on Radiological Protection (ICRP) Publication 96, Protecting People Against Radiation Exposure in the Event of a Radiological Attack.
3 Saskatchewan Environmental Quality Guidelines, Table 20: Saskatchewan Ambient Air Quality Standards. Values are calculated as geometric means.
* Reference levels are based on Province of Ontario Ambient Air Quality Criteria and are shown for reference only. No federal or Saskatchewan provincial limits were established at the time of this report.
Soil and terrestrial vegetation may be affected by the atmospheric deposition of particulate and adsorbed metals and radionuclides associated with onsite activities. A terrestrial monitoring program is in place and includes triennial measurements of metals and radionuclides in soil and blueberry samples.
Soil, blueberry twig and lichen samples were last collected in 2021, as required by the triennial sampling program. The results indicated that the parameters measured were within historical ranges.
CNSC staff concluded that the level of airborne particulate contaminants produced by the McArthur River Operation is acceptable and does not pose a risk to the environment.
Uncontrolled releases
In 2021, no events reported to the CNSC were classified as a release (spill) of a hazardous substance to the environment. CNSC spill rating definitions can be found in appendix I, table I-2.
Figure 2.10 in section 2 shows the number of spills at the McArthur River Operation from 2017 to 2021.
Assessment and monitoring
CNSC staff confirmed that the licensee, in accordance with the McArthur River environmental protection program, successfully carried out the required environmental monitoring.
Through the compliance verification activities conducted and the review of annual reports and environmental protection reports (EPRs), CNSC staff concluded that the environmental monitoring conducted at the McArthur River Operation met regulatory requirements. Consequently, CNSC staff concluded that the environment remains protected.
Environmental risk assessment
In 2020, the McArthur River EPR and updated environmental risk assessment (ERA) for 2015 to 2019 were submitted to the CNSC and the Saskatchewan Ministry of Environment. CNSC staff reviewed the environmental monitoring results for air, soil, vegetation, surface water, groundwater and sediment, as well as the health indicators for fish and their prey inhabiting sediment, and confirmed that the results to date were within those predicted in the ERA. After reviewing the EPR and ERA data collected, CNSC staff concluded that adequate measures have been taken at the McArthur River Operation to protect the environment.
Protection of people
Cameco is required to demonstrate that the health and safety of the public are protected from exposures to hazardous substances released from the McArthur River Operation. The effluent and environmental monitoring programs currently conducted by the licensee are used to verify that releases of hazardous substances do not result in environmental concentrations that may affect public health.
The CNSC receives reports of discharges to the environment through the reporting requirements outlined in the licence and LCH. The review of the McArthur River Operation’s hazardous (non-radiological) discharges to the environment indicates that the public and the environment are protected. CNSC staff confirmed that environmental concentrations in the vicinity of the McArthur River Operation remained within those predicted in the ERA, and that human health remained protected.
Based on compliance verification activities that included inspections and the review of the licensee’s reports, work practices and monitoring results for 2021, CNSC staff concluded that the McArthur River Operation’s environmental protection program continued to be effective at protecting the public and the environment.
4.4 Conventional health and safety
CNSC staff rated the conventional health and safety SCA as “satisfactory” based on regulatory oversight activities conducted in 2021.
| 2017 | 2018 | 2019 | 2020 | 2021 |
| SA | SA | SA | SA | SA |
SA = satisfactory
Cameco includes program documentation for the conventional health and safety SCA as part of the overall management system documents; these form part of the licensing basis for this facility in the LCH.
There were 2 inspections conducted at the McArthur River Operation that examined elements of the conventional health and safety SCA. No non‑compliances were identified during these inspections, and there were no event reports for which this SCA was the main contributory factor.
Practices
To promote continued effective safety performance, the McArthur River Operation has implemented a health and safety management program to identify and mitigate risks at the facility. The program includes a safety permit system, continued training, planned internal inspections, occupational health committees and incident investigations. The incident reporting system includes investigating and reporting on near misses, and reduces the chance of future incidents that could cause injury. CNSC staff verified that Cameco’s conventional health and safety work practices and conditions at the McArthur River Operation met regulatory requirements in 2021.
Performance
Table 4.3 summarizes lost-time injuries (LTIs) at the McArthur River Operation between 2017 and 2021. There were no LTIs at the McArthur River Operation in 2021.
The table also includes the total recordable incident rate (TRIR) for McArthur River for the last 5 years. The TRIR is the incident frequency rate that measures the number of fatalities, LTIs and other injuries requiring medical treatment, per 200,000 person-hours worked.
| 2017 | 2018 | 2019 | 2020 | 2021 | |
|---|---|---|---|---|---|
| Lost-time injuries1 | 1 | 0 | 0 | 0 | 0 |
| Severity rate2 | 12.11 | 23.2* | 0 | 0 | 0 |
| Frequency rate3 | 0.15 | 0 | 0 | 0 | 0 |
| Total recordable incident rate4 | 5.24 | 5.02 | 2.12 | 1.98 | 0.70 |
1 An injury that takes place at work and results in the worker being unable to return to work for a period of time.
2 A measure of the total number of days lost to injury for every 200,000 person-hours worked at the facility. Accident severity rate = [(# of days lost in last 12 months) / (# of hours worked in last 12 months)] x 200,000.
3 A measure of the number of LTIs for every 200,000 person-hours worked at the facility. Accident frequency rate = [(# of injuries in last 12 months) / (# of hours worked in last 12 months)] x 200,000.
4 A measure of the number of fatalities, LTIs and other injuries requiring medical treatment for every 200,000 person-hours worked at the facility. Recordable incident rate = [(# of incidents in last 12 months) / (# of hours worked in last 12 months)] x 200,000.
* Severity rating of 23.2 is related to time lost in 2018 due to injuries that occurred in 2016 and 2017.
Awareness
CNSC staff observed that the conventional health and safety program at the McArthur River Operation continued to provide education, training, tools and support to workers. Managers, supervisors and workers share and promote the idea that safety is the responsibility of all individuals. The facility’s management stresses the importance of conventional health and safety through regular communication, management oversight and the continual improvement of safety systems.
CNSC staff verified that the health and safety program at the McArthur River Operation met regulatory requirements.
4.5 Additional SCAs
In this 2021 report, CNSC staff have provided a brief discussion of the additional SCAs; these are presented in the following sections.
4.5.1 Management system
Cameco maintains a quality management program; this forms part of the licensing basis for the McArthur River Operation in the LCH.
There were no inspections at the McArthur River Operation that focused on evaluating the management system SCA in 2021 and no event reports for which this SCA was the main contributory factor.
CNSC staff concluded that the licensee’s program in respect of this SCA remains satisfactory.
4.5.2 Human performance management
Cameco includes program documentation for the human performance management SCA as part of the overall management system documents; these form part of the licensing basis in the LCH.
There was 1 inspection at the McArthur River Operation that focused on evaluating the human performance management SCA in 2021. There were no event reports for which this SCA was the main contributory factor.
CNSC staff concluded that the licensee’s program in respect of this SCA remains satisfactory.
4.5.3 Operating performance
Cameco includes program documentation for the operating performance SCA as part of the overall management system documents; these form part of the licensing basis for the McArthur River Operation in the LCH.
There were no inspections at the McArthur River Operation that focused on evaluating the operating performance SCA in 2021 and no event reports for which this SCA was the main contributory factor.
CNSC staff concluded that the licensee’s program in respect of this SCA remains satisfactory.
4.5.4 Safety analysis
Cameco includes program documentation for the safety analysis SCA as part of the overall management system documents; these form part of the licensing basis for the McArthur River Operation in the LCH.
There were no inspections at the McArthur River Operation that focused on evaluating the safety analysis SCA in 2021 and no event reports for which this SCA was the main contributory factor.
CNSC staff concluded that the licensee’s program in respect of this SCA remains satisfactory.
4.5.5 Physical design
Cameco includes program documentation for the physical design SCA as part of the overall management system documents; these form part of the licensing basis for the McArthur River Operation in the LCH.
There were no inspections at the McArthur River Operation that focused on evaluating the physical design SCA in 2021 and no event reports for which this SCA was the main contributory factor.
CNSC staff concluded that the licensee’s program in respect of this SCA remains satisfactory.
4.5.6 Fitness for service
Cameco includes program documentation for the fitness for service SCA as part of the overall management system documents; these form part of the licensing basis for the McArthur River Operation in the LCH.
There were no inspections at the McArthur River Operation that focused on evaluating the fitness for service SCA in 2021 and no event reports for which this SCA was the main contributory factor.
CNSC staff concluded that the licensee’s program in respect of this SCA remains satisfactory.
4.5.7 Emergency management and fire protection
Cameco includes program documentation for the emergency management and fire protection SCA as part of the overall management system documents; these form part of the licensing basis for the McArthur River Operation in the LCH.
There was 1 inspection at the McArthur River Operation in 2021 that evaluated the emergency management and fire protection SCA. The inspection identified 1 non-compliance of low safety significance, and the CNSC determined that the corrective action taken by the licensee was sufficient. There were no event reports for which this SCA was the main contributory factor.
CNSC staff concluded that the licensee’s program in respect of this SCA remains satisfactory.
4.5.8 Waste management
Cameco includes program documentation for the waste management SCA as part of the overall management system documents; these form part of the licensing basis for the McArthur River Operation in the LCH.
There were no inspections at the McArthur River Operation that focused on evaluating the waste management SCA in 2021 and no event reports for which this SCA was the main contributory factor.
CNSC staff concluded that the licensee’s program in respect of this SCA remains satisfactory.
4.5.9 Security
Cameco includes program documentation for the security SCA as part of the overall management system documents; these form part of the licensing basis for the McArthur River Operation in the LCH.
There were no inspections at the McArthur River Operation that focused on evaluating the security SCA in 2021 and no event reports for which this SCA was the main contributory factor.
CNSC staff concluded that the licensee’s program in respect of this SCA remains satisfactory.
4.5.10 Safeguards and non-proliferation
Cameco includes program documentation for the safeguards and non-proliferation SCA as part of the overall management system documents; these form part of the licensing basis for the McArthur River Operation in the LCH.
A CNSC inspection performed in 2021 verified the McArthur River Operation’s compliance with reporting requirements under the safeguards and non‑proliferation SCA. There were no event reports for which this SCA was the main contributory factor.
In addition to CNSC compliance activities relating to the specific areas under the safeguards and non-proliferation SCA, the International Atomic Energy Agency (IAEA) conducts independent inspections, with coordination and support provided through the CNSC regulatory framework. No IAEA inspections were conducted at the McArthur River Operation in 2021.
CNSC staff concluded that the licensee’s program in respect of this SCA remains satisfactory.
4.5.11 Packaging and transport
Cameco includes program documentation for the packaging and transport SCA as part of the overall management system documents; these form part of the licensing basis for the McArthur River Operation in the LCH.
There were no inspections at the McArthur River Operation that focused on evaluating the packaging and transport SCA. No shipments of ore were sent from McArthur River in 2021. In addition, there were no event reports for which this SCA was the main contributory factor.
CNSC staff concluded that the licensee’s program in respect of this SCA remains satisfactory.
5 Rabbit Lake Operation
The Rabbit Lake Operation is located 750 kilometres north of Saskatoon, Saskatchewan. Owned and operated by Cameco Corporation (Cameco), the facility stretches across approximately 20 kilometres. It consists of an underground mine; 3 minded-out pits, of which 2 are reclaimed; an in-pit tailings management facility (TMF); a mill; and supporting infrastructure. Figure 5.1 provides an aerial view of the mill area of the Rabbit Lake Operation.
In October 2013, following a public hearing in La Ronge, Saskatchewan, the Commission issued a 10-year licence to Cameco for the Rabbit Lake Operation. Cameco’s licence expires on October 31, 2023. In March 2021, Cameco’s licence was renewed to conform to the standardized CNSC licence format and conditions, and included a renewed financial guarantee.
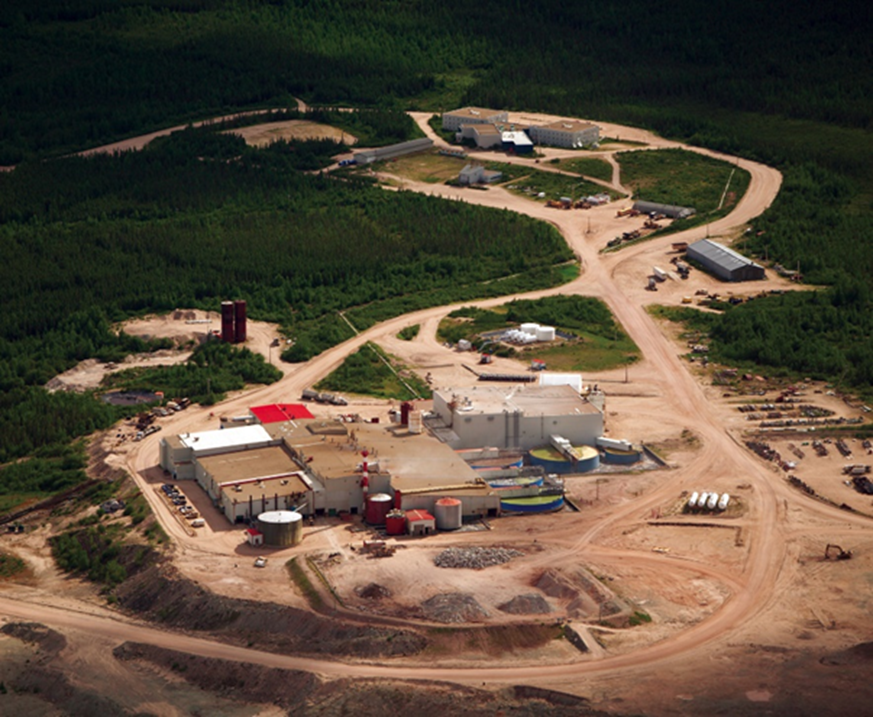
Source: CNSC
Mining production data for the Rabbit Lake Operation are provided in table 5.1.
| Mining | 2017 | 2018 | 2019 | 2020 | 2021 |
|---|---|---|---|---|---|
| Ore tonnage (Mkg/year) | 0 | 0 | 0 | 0 | 0 |
| Average ore grade mined (% U) | 0 | 0 | 0 | 0 | 0 |
|
Uranium mined (Mkg U/year) |
0 | 0 | 0 | 0 | 0 |
In 2016, Cameco halted mining and milling operations at the Rabbit Lake Operation and the facility was placed in a safe state of care and maintenance.
No uranium concentrate was produced and no ore production was conducted at the Rabbit Lake Operation during the 2021 reporting period. Table 5.2 provides milling production data from 2017 to 2021.
| Milling | 2017 | 2018 | 2019 | 2020 | 2021 |
|---|---|---|---|---|---|
| Mill ore feed (Mkg/year) | 0 | 0 | 0 | 0 | 0 |
| Average annual mill feed grade (% U) | 0 | 0 | 0 | 0 | 0 |
| Percent uranium recovery (%) | 0 | 0 | 0 | 0 | 0 |
| Uranium concentrate produced (Mkg U/year) | 0 | 0 | 0 | 0 | 0 |
| Authorized annual production (Mkg U/year) | 4.25 | 4.25 | 4.25 | 4.25 | 4.25 |
5.1 Performance
For 2021, CNSC staff rated all 14 SCAs at the Rabbit Lake Operation as “satisfactory” based on regulatory oversight activities. The SCA ratings for the 5‑year period from 2017 to 2021 are shown in appendix E.
In 2021, CNSC staff conducted 2 inspections at the Rabbit Lake Operation that focused on the following SCAs: operating performance, emergency management and fire protection, fitness for service, conventional health and safety, radiation protection, and human performance management (training). There was 1 non‑compliance identified during the inspections. One planned CNSC inspection at Rabbit Lake for 2021 was postponed until July 2022 so that it could be conducted onsite. A list of inspections is provided in appendix B.
5.2 Radiation protection
For 2021, CNSC staff continued to rate the radiation protection SCA at Rabbit Lake as “satisfactory” based on regulatory oversight activities.
| 2017 | 2018 | 2019 | 2020 | 2021 |
|---|---|---|---|---|
| SA | SA | SA | SA | SA |
SA = satisfactory
Radiological hazard control
The sources of radiological exposure at the Rabbit Lake Operation during production were from mining at the Eagle Point underground mine and from milling uranium ore into yellowcake at the Rabbit Lake mill. The effective dose contributors to nuclear energy workers (NEWs) at Rabbit Lake were radon progeny (75%), gamma radiation (17%), LLRD(5%) and radon gas (3%). Effective doses to NEWs from exposures to radon progeny, radon gas and LLRD are controlled through the effective use of source control, ventilation, contamination control and personal protective equipment. Gamma radiation exposure is controlled through practices related to the effective use of time, distance and shielding.
Radiation protection program performance
In 2021, CNSC staff were satisfied that the radiation protection program and practices at the Rabbit Lake Operation remained effective at controlling radiological exposure to workers. The doses to workers remained below regulatory limits and as low as reasonably achievable (ALARA). No exceedances of action levels were reported at the Rabbit Lake Operation in 2021.
Application of ALARA
In 2021, the collective dose to NEWs at the Rabbit Lake Operation was 93 person-millisieverts (p-mSv), a minor increase over the 2020 value of 89 p‑mSv (see figure 5.2).
Figure 5.2 displays the annual collective radiation exposures at the Rabbit Lake Operation from 2017 to 2021.
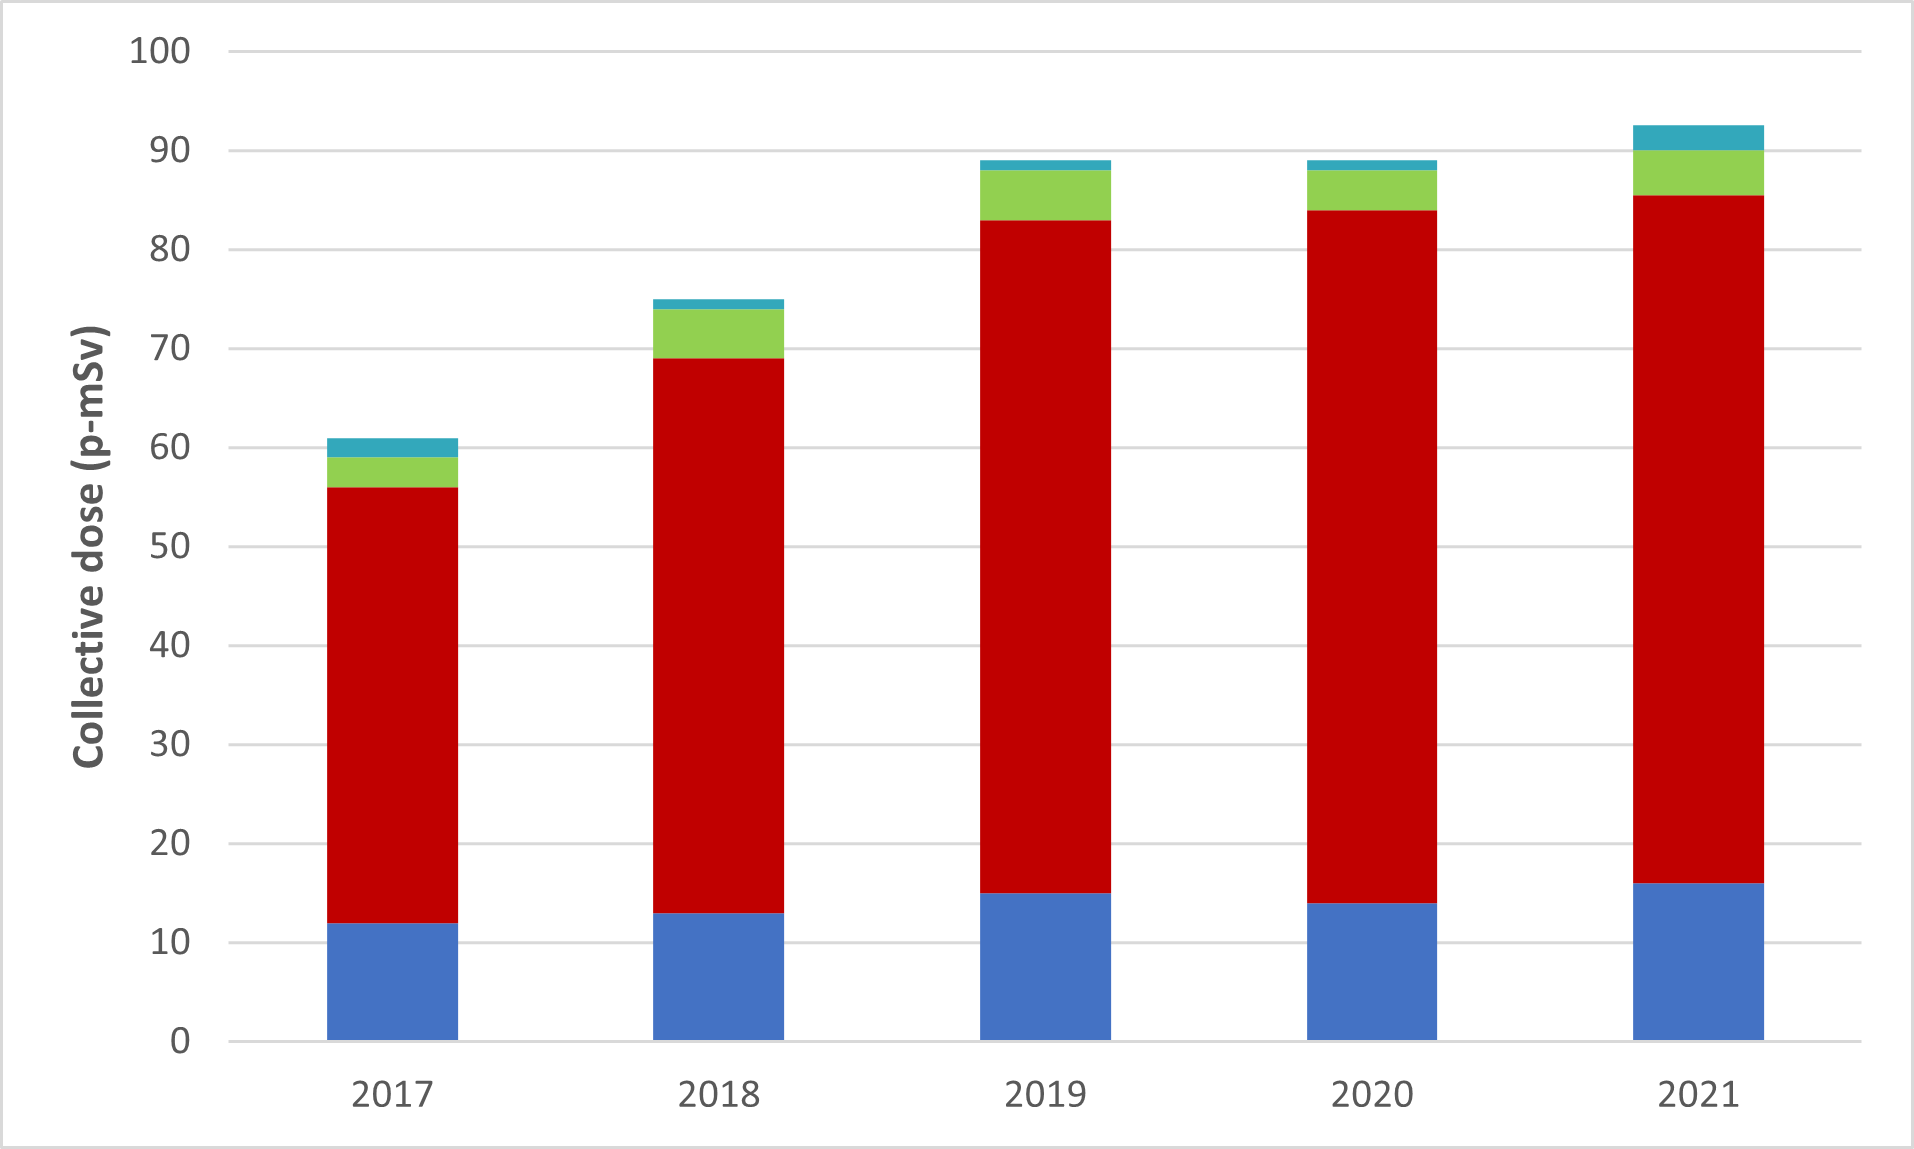
Figure 5.2: Text version
A graph showing the annual collective effective dose to nuclear energy workers at the Rabbit Lake Operation from 2017 to 2021. The table shows the collective dose values to nuclear energy workers at the Rabbit Lake Operation for the same period.
| 2017 | 2018 | 2019 | 2020 | 2021 | |
|---|---|---|---|---|---|
| Gamma (p-mSv) | 12 | 13 | 15 | 14 | 16 |
| RnP (p-mSv) | 44 | 56 | 68 | 70 | 70 |
| LLRD (p-mSv) | 3 | 5 | 5 | 4 | 5 |
| RnG (p-mSv) | 2 | 1 | 1 | 1 | 3 |
| Total* | 61 | 76 | 89 | 89 | 93 |
RnP = radon progeny; LLRD = long-lived radioactive dust; RnG = radon gas
* The total collective dose may not match the individual components due to rounding errors.
In 2021, the Rabbit Lake Operation identified 3 targets for the ALARA program. The first 2 were to investigate options to lower radon progeny levels in the mill shop and the mill warehouse. The third target was to conduct follow-up sampling for ventilation and heating optimization to ensure the control of radon progeny levels.
CNSC staff verified through regulatory oversight activities that Cameco continued to keep worker exposures ALARA.
Worker dose control
In 2021, the average individual effective dose to NEWs was 0.57 mSv and the maximum individual effective dose was 2.47 mSv. This is lower than the average effective dose of 0.70 mSv and the maximum individual dose of 2.93 mSv in 2020. As indicated in figures 2.3 and 2.4 (section 2), all individual effective doses to NEWs were below the annual regulatory limit of 50 mSv. The 5-year dosimetry period of 2021 to 2025 has just started. So far, the maximum dose is 2.47 mSv (~ 2.5% of the 100 mSv dose limit).
Based on CNSC staff’s compliance verification activities, such as inspections and the review of the licensee’s reports, work practices, monitoring of results, and individual effective dose results for 2021, CNSC staff were satisfied that the Rabbit Lake Operation continued to be effective at controlling radiation doses to workers.
5.3 Environmental protection
For 2021, CNSC staff continued to rate the environmental protection SCA at Rabbit Lake as “satisfactory” based on regulatory oversight activities. CNSC staff concluded that the licensee’s environmental protection program was effectively implemented and met all regulatory requirements.
| 2017 | 2018 | 2019 | 2020 | 2021 |
|---|---|---|---|---|
| SA | SA | SA | SA | SA |
SA = satisfactory
Environmental management system
The environmental management system at the Rabbit Lake Operation includes activities such as establishing annual environmental objectives, goals and targets. Cameco conducts internal audits of its environmental protection program at the Rabbit Lake Operation as identified in its CNSC-approved management system program. CNSC staff review and assess the objectives, goals and targets through regular compliance verification activities. CNSC staff noted that Cameco continued to carry out routine inspections, internal audits, environmental training, and periodic reviews of environmental monitoring data. These activities were conducted to verify continual improvement and to confirm that the controls put in place to protect the environment are effective.
Effluent and emissions control
Treated effluent released to the environment
For previously identified constituents of potential concern (COPCs) with the potential to adversely affect the environment (i.e., uranium, molybdenum and selenium), the effluent treatment system at the Rabbit Lake Operation continued to meet performance expectations in terms of reducing the concentrations of these parameters (see figures 2.5 to 2.7 in section 2). At times in 2021, molybdenum concentrations were above the historical mean; however, the mean annual concentration (0.184 mg/L) remained relatively consistent with the 3-year historical mean (0.174 mg/l) and was stable most of the year. Molybdenum concentrations did not exceed action levels at any time in 2021.
As shown in section 2.3, CNSC staff verified that the Rabbit Lake Operation continued to meet the discharge limits set out in the Metal and Diamond Mining Effluent Regulations Footnote 8.
Cameco’s environmental management system and effluent monitoring programs at the Rabbit Lake Operation met regulatory requirements, and all treated effluent discharged to the environment complied with licence requirements. In 2021, the concentrations of regulated parameters in treated effluent released to the environment were well below the regulatory limits, and there were no exceedances of environmental action levels at the Rabbit Lake Operation. Figure 5.3 shows the B-Zone settling pond at the Rabbit Lake Operation. CNSC staff will continue to review effluent quality results to verify that effluent treatment performance remains effective.
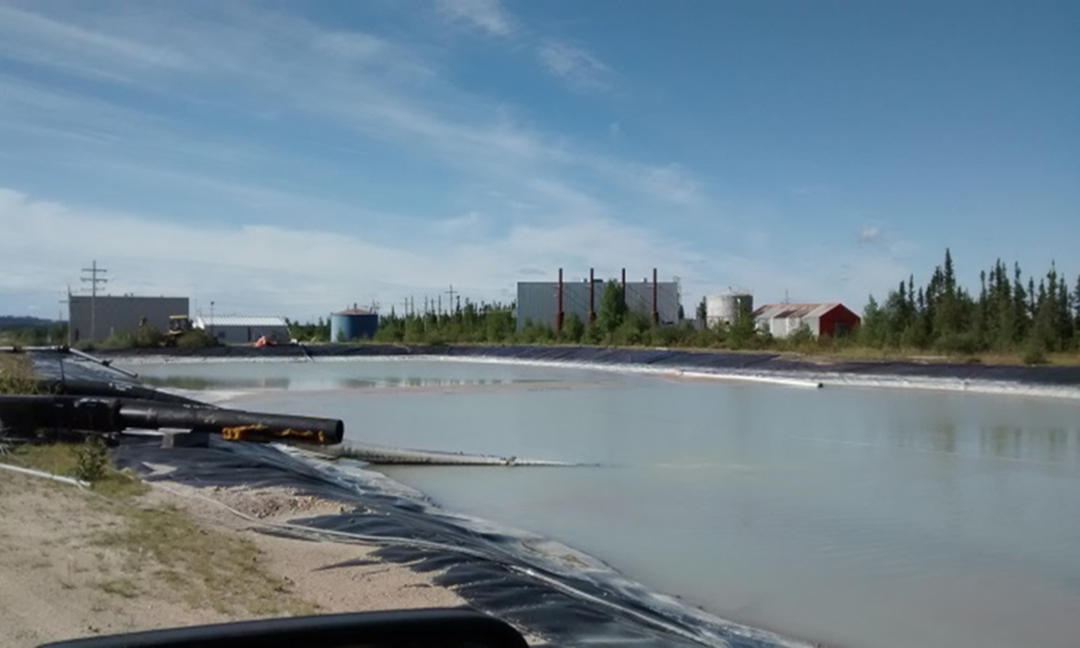
Source: Cameco
Air emissions released to the environment
Cameco also maintains an air and terrestrial monitoring program at the Rabbit Lake Operation. Air and terrestrial monitoring at the Rabbit Lake facility includes ambient radon, total suspended particulate (TSP), sulphur dioxide, soil sampling and lichen sampling to assess the impact of air emissions.
Radon in ambient air around the Rabbit Lake Operation is monitored at 19 stations using passive track-etch cups. Figure 5.4 shows that the average concentrations of radon in ambient air from 2017 to 2021 were similar to background concentrations for northern Saskatchewan’s regional baseline of less than 7.4 Bq/m3 to 25 Bq/m3. The average radon concentrations were less than the reference level of 60 Bq/m3, which represents an incremental dose of 1 mSv/year above background.
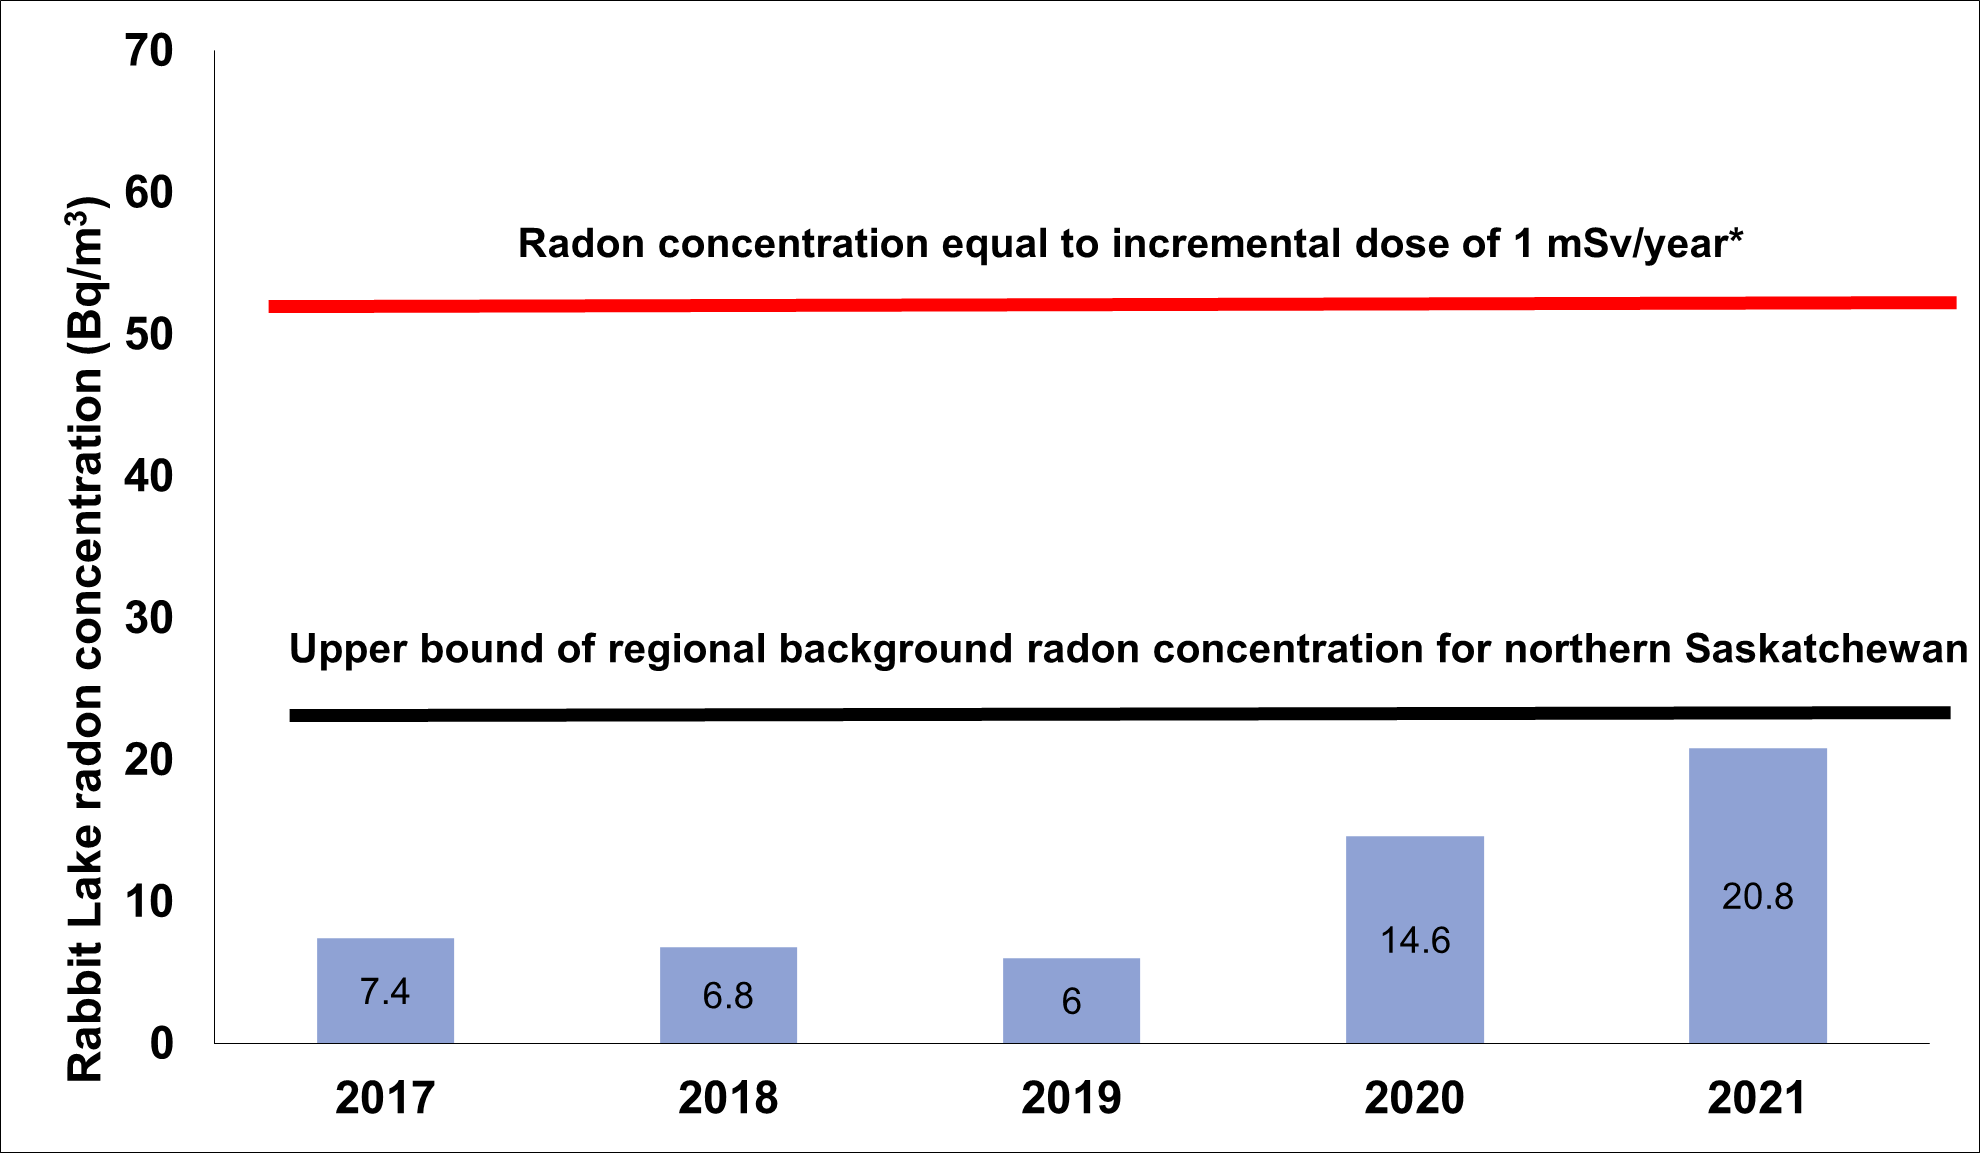
Figure 5.4: Text version
A graph showing the average concentration of radon gas in ambient air at the Rabbit Lake Operation from 2017 to 2021. The upper bound of regional background radon concentration for Northern Saskatchewan is 28 Becquerels per meter cubed. The radon concentration equal to an incremental dose of 1 millisievert per year is 59 Becquerels per meter cubed.
| 2017 | 2018 | 2019 | 2020 | 2021 | |
|---|---|---|---|---|---|
| Radon concentrations (Bq/m3) | 7.4 | 6.8 | 6.0 | 14.6 | 20.8 |
* Upper bound of the incremental dose of 1 mSv per year above background (i.e., an incremental radon concentration of 30 Bq/m3 above natural background), based on International Commission on Radiological Protection (ICRP) Publication 115, Lung Cancer Risk from Radon and Progeny and Statement on Radon. Values are calculated as geometric means.
Three high-volume air samplers were used to collect and measure TSP in air. The TSP levels from the average of the 3 stations were lower than provincial standards (see table 5.3). TSP samples were also analyzed for concentrations of metals and radionuclides. The mean concentrations of metals and radionuclides adsorbed to TSP were low and were below the reference annual air quality levels identified in table 5.3.
| Parameter | Reference annual air quality levels* | 2017 | 2018 | 2019 | 2020 | 2021 |
|---|---|---|---|---|---|---|
| TSP (µg/m3) | 60 (3) | 4.79 | 3.91 | 4.31 | 3.00 | 3.67 |
| As (µg/m3) | 0.06 (1) | 0.000285 | 0.000365 | 0.000128 | 0.000247 | 0.000168 |
| Ni (µg/m3) | 0.04 (1) | 0.000404 | 0.000183 | 0.000140 | 0.000580 | 0.000157 |
| Pb-210 (Bq/m3) | 0.021 (2) | 0.000013 | 0.000015 | 0.000006 | 0.000007 | 0.000010 |
| Ra-226 (Bq/m3) | 0.013 (2) | 0.0000004 | 0.0000002 | 0.000000 | 0.0000002 | 0.000000 |
| Th-230 (Bq/m3) | 0.0085 (2) | 0.0000004 | 0.0000003 | 0.0000000 | 0.0000000 | 0.000000 |
| U (µg/m3) | 0.06 (1) | 0.000190 | 0.000277 | 0.000117 | 0.00012 | 0.000148 |
1 Reference annual air quality levels are derived from Ontario’s 24-hour Ambient Air Quality Criteria (2012).
2 Reference level is derived from International Commission on Radiological Protection (ICRP) Publication 96, Protecting People Against Radiation Exposure in the Event of a Radiological Attack.
3 Saskatchewan Environmental Quality Guidelines, Table 20: Saskatchewan Ambient Air Quality Standards. Values are calculated as geometric means.
* Reference levels are based on Province of Ontario Ambient Air Quality Criteria and are shown for reference only. No federal or Saskatchewan provincial limits were established at the time of this report.
Daily in-stack monitoring of sulphur dioxide emissions from the mill acid plant was discontinued in 2017 for the duration of the care and maintenance period, as the acid plant and mill processing circuits have not operated in that time.
Soil and terrestrial vegetation may be affected by the atmospheric deposition of particulate and adsorbed metals and radionuclides associated with onsite activities. A terrestrial monitoring program is in place and includes measurements of metals and radionuclides in lichen.
Lichen sampling has been conducted for 3 decades at the Rabbit Lake Operation, most recently in 2019. CNSC staff concluded that the level of airborne particulate contaminants produced by the Rabbit Lake Operation does not pose a risk to lichen consumers, such as caribou.
Uncontrolled releases
In 2021, 4 events were reported where hazardous substances were released to the environment (spills) at the Rabbit Lake Operation. None of these events resulted in a residual impact to the environment or human health. CNSC staff were satisfied with the licensee’s reporting of the releases and the corrective actions taken. CNSC staff rate spills in accordance with the definitions provided in appendix I, table I-2. Figure 2.10 (section 2) shows the number of reportable environmental spills at the Rabbit Lake Operation from 2017 to 2021.
Appendix I provides a brief description of reported spills, the corrective actions taken by the licensee, CNSC staff’s assessment of those actions and the significance ratings for 2021.
Assessment and monitoring
CNSC staff confirmed that the licensee successfully carried out the required environmental monitoring in accordance with the Rabbit Lake environmental protection program.
Through the compliance activities conducted and the review of annual reports and EPRs, CNSC staff concluded that the environmental monitoring conducted at the Rabbit Lake Operation met regulatory requirements. Consequently, CNSC staff concluded that the environment remains protected.
Environmental risk assessment
The Rabbit Lake Operation’s updated ERA for 2015 to 2019 was submitted to the CNSC and the Saskatchewan Ministry of Environment in December 2020. CNSC staff are currently finalizing their review of the environmental monitoring results for air, soil, vegetation, surface water, groundwater and sediment, as well as the health indicators for fish and their prey inhabiting sediment, to confirm that the results are within those predicted in the ERA. The ERA review process is still ongoing.
Protection of people
Cameco is required to demonstrate that the health and safety of the public are protected from exposures to hazardous substances released from the Rabbit Lake Operation. The effluent and environmental monitoring programs currently conducted by the licensee are used to verify that releases of hazardous substances do not result in environmental concentrations that may affect public health.
The CNSC receives reports of discharges to the environment through the reporting requirements outlined in the licence and the LCH. The review of the Rabbit Lake Operation’s hazardous (non-radiological) discharges to the environment indicates that the public and environment are protected. CNSC staff confirmed that environmental concentrations in the vicinity of the Rabbit Lake Operation remained within those predicted in the current 2015 ERA and that human health remained protected in 2021.
Based on compliance verification activities that included inspections and the review of the licensee’s reports, work practices and monitoring results for 2021, CNSC staff concluded that the Rabbit Lake Operation’s environmental protection program continued to be effective at protecting the public and the environment.
5.4 Conventional health and safety
For 2021, CNSC staff continued to rate the conventional health and safety SCA as “satisfactory” based on regulatory oversight activities.
| 2017 | 2018 | 2019 | 2020 | 2021 |
|---|---|---|---|---|
| SA | SA | SA | SA | SA |
SA = satisfactory
Practices
Cameco’s Rabbit Lake Operation has implemented a health and safety program to identify and mitigate risks. The program includes internal inspections, a safety permit system, occupational health committees, training, and incident investigations. CNSC staff monitor this program through compliance activities to verify the protection of workers.
The incident reporting system at the Rabbit Lake Operation includes reporting on and investigating near misses, with the aim of reducing future incidents that could cause injury. CNSC compliance verification activities confirmed that the Rabbit Lake Operation continued to focus on preventing accidents and injuries through the implementation of its health and safety management program.
Performance
No LTIs were reported for the Rabbit Lake Operation in 2021. LTI performance at the Rabbit Lake Operation from 2017 to 2021 is shown in table 5.4.
The TRIR at Rabbit Lake is included for the last 5 years. The TRIR is the incident frequency rate that measures the number of fatalities, LTIs and other injuries requiring medical treatment, per 200,000 person-hours worked.
| 2017 | 2018 | 2019 | 2020 | 2021 | |
|---|---|---|---|---|---|
| Lost-time injuries1 | 0 | 0 | 1 | 0 | 0 |
| Severity rate2 | 0 | 0 | 104.79 | 40.860 | 0 |
| Frequency rate3 | 0 | 0 | 1.05 | 0 | 0 |
| Total recordable incident rate4 | 1.03 | 5.03 | 2.10 | 1.13 | 1.04 |
1An injury that takes place at work and results in the worker being unable to return to work for a period of time.
2A measure of the total number of days lost to injury for every 200,000 person-hours worked at the facility. Accident severity rate = [(# of days lost in last 12 months) / (# of hours worked in last 12 months)] x 200,000.
3 A measure of the number of LTIs for every 200,000 person-hours worked at the facility. Accident frequency rate = [(# of injuries in last 12 months) / (# of hours worked in last 12 months)] x 200,000.
4 A measure of the number of fatalities, LTIs and other injuries requiring medical treatment for every 200,000 person-hours worked at the facility. Recordable incident rate = [(#incidents in last 12 months) / (# hours worked in last 12 months)] x 200,000.
Awareness
CNSC staff observed that Cameco’s conventional health and safety program at the Rabbit Lake Operation continued to provide education, training, tools and support to workers. Managers, supervisors and workers share and promote the idea that safety is the responsibility of all individuals. Facility management emphasizes the importance of conventional health and safety through regular communication, management oversight and the continual improvement of safety systems.
CNSC staff verified that the conventional health and safety program at the Rabbit Lake Operation remained effective at managing health and safety risks.
5.5 Additional SCAs
In this 2021 regulatory oversight report, CNSC staff have provided a brief discussion of the additional SCAs; these are presented in the following sections.
5.5.1 Management system
The licensee maintains a quality management program; this program forms part of the licensing basis for the Rabbit Lake Operation in the LCH.
There were no inspections at the Rabbit Lake Operation that focused on evaluating the management system SCA in 2021 and no event reports for which this SCA was the main contributory factor.
CNSC staff concluded that the licensee’s program in respect of this SCA remains satisfactory.
5.5.2 Human performance management
The licensee includes program documentation for the human performance management SCA as part of the overall management system documents; these form part of the licensing basis for the Rabbit Lake Operation in the LCH.
There were no inspections at the Rabbit Lake Operation that focused on evaluating the human performance management SCA in 2021 and no event reports for which this SCA was the main contributory factor.
CNSC staff concluded that the licensee’s program in respect of this SCA remains satisfactory.
5.5.3 Operating performance
The licensee includes program documentation for the operating performance SCA as part of the overall management system documents; these form part of the licensing basis for the Rabbit Lake Operation in the LCH.
There were no inspections at the Rabbit Lake Operation that focused on evaluating the operating performance SCA in 2021 and no event reports for which this SCA was the main contributory factor.
CNSC staff concluded that the licensee’s program in respect of this SCA remains satisfactory.
5.5.4 Safety analysis
The licensee includes program documentation for the safety analysis SCA as part of the overall management system documents; these form part of the licensing basis for the Rabbit Lake Operation in the LCH.
There were no inspections at the Rabbit Lake Operation that focused on evaluating the safety analysis SCA in 2021 and no event reports for which this SCA was the main contributory factor.
CNSC staff concluded that the licensee’s program in respect of this SCA remains satisfactory.
5.5.5 Physical design
The licensee includes program documentation for the physical design SCA as part of the overall management system documents; these form part of the licensing basis for the Rabbit Lake Operation in the LCH.
There were no inspections at the Rabbit Lake Operation that focused on evaluating the physical design SCA in 2021 and no event reports for which this SCA was the main contributory factor.
CNSC staff concluded that the licensee’s program in respect of this SCA remains satisfactory.
5.5.6 Fitness for service
The licensee includes program documentation for the fitness for service SCA as part of the overall management system documents; these form part of the licensing basis for the Rabbit Lake Operation in the LCH.
There were no inspections at the Rabbit Lake Operation that focused on evaluating the fitness for service SCA in 2021 and no event reports for which this SCA was the main contributory factor.
CNSC staff concluded that the licensee’s program in respect of this SCA remains satisfactory.
5.5.7 Emergency management and fire protection
The licensee includes program documentation for the emergency management and fire protection SCA as part of the overall management system documents; these form part of the licensing basis for the Rabbit Lake Operation in the LCH.
There were no inspections at the Rabbit Lake Operation that focused on evaluating the emergency management and fire protection SCA in 2021 and no event reports for which this SCA was the main contributory factor.
CNSC staff concluded that the licensee’s program in respect of this SCA remains satisfactory.
5.5.8 Waste management
The licensee includes program documentation for the waste management SCA as part of the overall management system documents; these form part of the licensing basis for the Rabbit Lake Operation in the LCH.
There were no inspections at the Rabbit Lake Operation that focused on evaluating the waste management SCA in 2021 and no event reports for which this SCA was the main contributory factor.
CNSC staff concluded that the licensee’s program in respect of this SCA remains satisfactory.
5.5.9 Security
The licensee includes program documentation for the security SCA as part of the overall management system documents; these form part of the licensing basis for the Rabbit Lake Operation in the LCH.
There were no inspections at the Rabbit Lake Operation that focused on evaluating the security SCA in 2021 and no event reports for which this SCA was the main contributory factor.
CNSC staff concluded that the licensee’s program in respect of this SCA remains satisfactory.
5.5.10 Safeguards and non-proliferation
The licensee includes program documentation for the safeguards and non‑proliferation SCA as part of the overall management system documents; these form part of the licensing basis for the Rabbit Lake Operation in the LCH.
There were no inspections at the Rabbit Lake Operation that focused on evaluating the safeguards and non-proliferation SCA in 2021. There were no notices of non-compliance related to the safeguards and non-proliferation SCA and no event reports for which this SCA was the main contributory factor.
In addition to CNSC compliance activities with respect to the specific areas under the safeguards and non-proliferation SCA, the International Atomic Energy Agency (IAEA) conducts independent inspections, with coordination and support provided through the CNSC regulatory framework. No IAEA inspections were conducted at the Rabbit Lake Operation in 2021.
CNSC staff concluded that the licensee’s program in respect of this SCA remains satisfactory.
5.5.11 Packaging and transport
The licensee includes program documentation for the packaging and transport SCA as part of the overall management system documents; these form part of the licensing basis for the Rabbit Lake Operation in the LCH.
There were no inspections at the Rabbit Lake Operation that focused on evaluating the packaging and transport SCA in 2021. No shipments of ore concentrate were sent from Rabbit Lake in 2021. In addition, there were no event reports for which this SCA was the main contributory factor.
CNSC staff concluded that the licensee’s program in respect of this SCA remains satisfactory.
6 Key Lake Operation
Cameco Corporation (Cameco) is the owner and operator of the Key Lake Operation, which is located approximately 570 kilometres north of Saskatoon, Saskatchewan. The operation began with 2 open-pit mines and a mill complex. The Gaertner open pit was mined from 1983 to 1987, followed by the Deilmann open pit until 1997. Uranium mining is no longer carried out at Key Lake. Figure 6.1 provides an aerial view of the Key Lake facility.
In October 2013, following a public hearing in La Ronge, Saskatchewan, the Commission issued a 10-year licence to Cameco for the Key Lake Operation. Cameco’s licence expires on October 31, 2023.
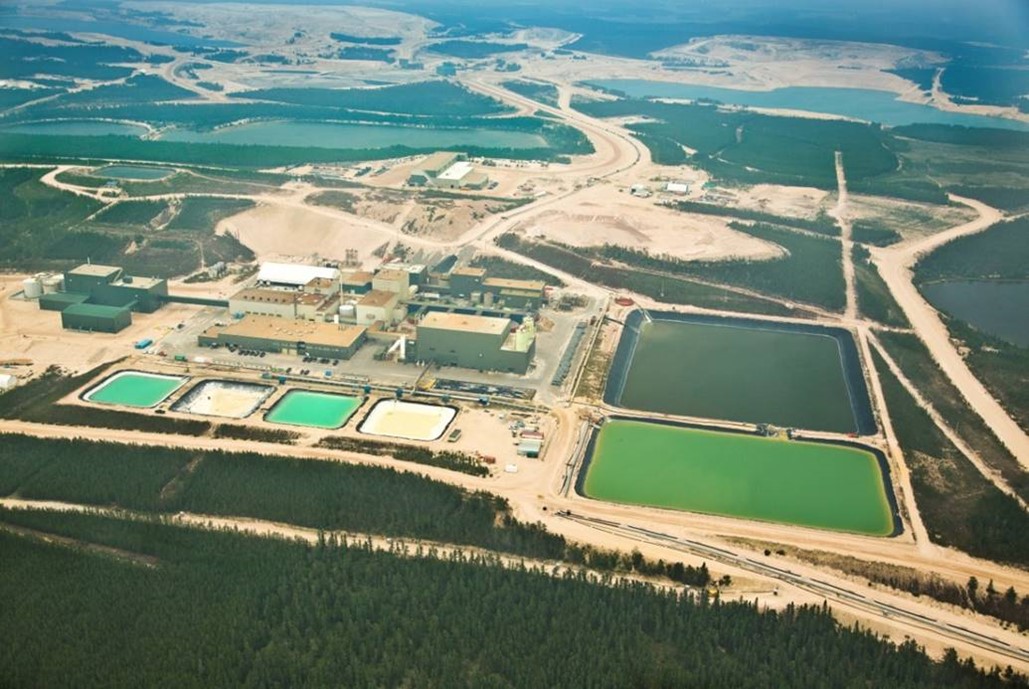
Source: Cameco
Milling of the stockpiled Deilmann ore continued until 1999. In 2000, the mill started processing ore from the McArthur River Operation. The Key Lake Operation continues today as a mill operation that is licensed to process McArthur River ore and residual special waste from previous mining at Key Lake.
After open-pit mining in the eastern pit of the Deilmann ore body was completed in 1995, the pit was converted to the engineered Deilmann tailings management facility (TMF), while mining continued in other parts of the pit area (see figure 6.2). Mill tailings continue to be deposited in this facility today.
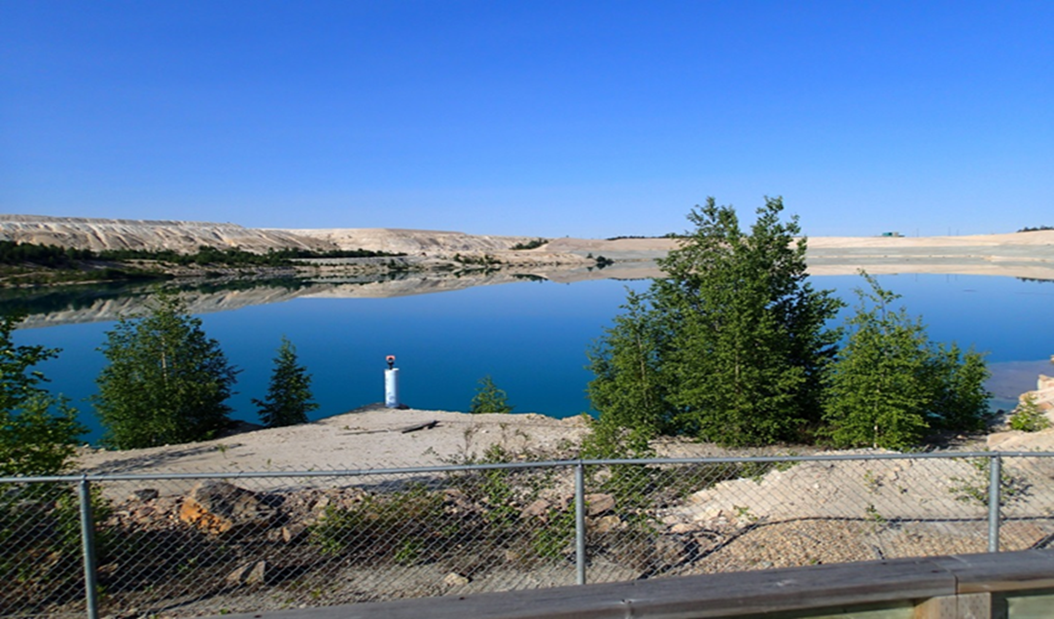
Source: CNSC
In 2018, the Key Lake Operation halted milling activities, and the mill facility was placed in safe care and maintenance. In 2022, Cameco indicated its intent to begin the process of transitioning the Key Lake Operation from care and maintenance to production. This will be reflected in next year’s regulatory oversight report.
Milling data for the Key Lake Operation during the 5-year reporting period are presented in table 6.1. The Key Lake Operation operated in a state of care and maintenance in 2021.
| Milling | 2017 | 2018 | 2019 | 2020 | 2021 |
|---|---|---|---|---|---|
|
Mill ore feed (Mkg/year) |
143.26 | 0 | 0 | 0 | 0 |
| Average annual mill feed grade (% U) | 4.37 | N/A | N/A | N/A | N/A |
| Percentage of uranium recovery (%) | 99.05 | N/A | N/A | N/A | N/A |
| Uranium concentrate produced (Mkg U/year) | 6.20 | 0.06* | 0.006** | 0 | 0 |
| Authorized annual production (Mkg U/year) | 9.60 | 9.60 | 9.60 | 9.60 | 9.60 |
* Processing of remaining ore slurry from 2017.
**From calciner clean-out and disposal of laboratory samples.
6.1 Performance
The SCA ratings at the Key Lake Operation for the 5-year period from 2017 to 2021 are shown in appendix E. CNSC staff continued to rate all SCAs for 2021 as “satisfactory” based on regulatory oversight activities.
In 2021, CNSC staff carried out 3 inspections at the Key Lake Operation that covered multiple SCAs. No non-compliances were identified during those inspections. A list of inspections can be found in appendix B.
This report covers all SCAs but focuses on the 3 SCAs that cover many of the key performance indicators for these mines and mills: radiation protection, environmental protection, and conventional health and safety.
6.2 Radiation protection
Based on regulatory oversight activities during the reporting period, CNSC staff rated the radiation protection SCA at the Key Lake Operation as “satisfactory”.
| 2017 | 2018 | 2019 | 2020 | 2021 |
| SA | SA | SA | SA | SA |
SA = satisfactory
Radiological hazard control
The effective dose contributors to nuclear energy workers (NEWs) at the Key Lake mill were gamma radiation (47%), radon progeny (35%) and LLRD (18%). Gamma radiation hazards are controlled through practices related to the effective use of time, distance and shielding. Radon progeny and LLRD are controlled through source control, ventilation, contamination control and personal protective equipment.
Radiation protection program performance
In 2021, CNSC staff were satisfied that the radiation protection program and practices at the Key Lake Operation remained effective at controlling radiological exposure to workers. The doses to workers remained below regulatory limits and as low as reasonably achievable (ALARA). No exceedances of action levels were reported at the Key Lake Operation in 2021.
Application of ALARA
In 2021, the collective dose to NEWs at the Key Lake Operation was 353 person‑millisieverts (p‑mSv), a 233% increase from the 2020 value of 106 p‑mSv (see figure 6.3). Although the collective dose in 2021 was higher than in 2020, it remains well below the normal values during active processing of uranium ore.
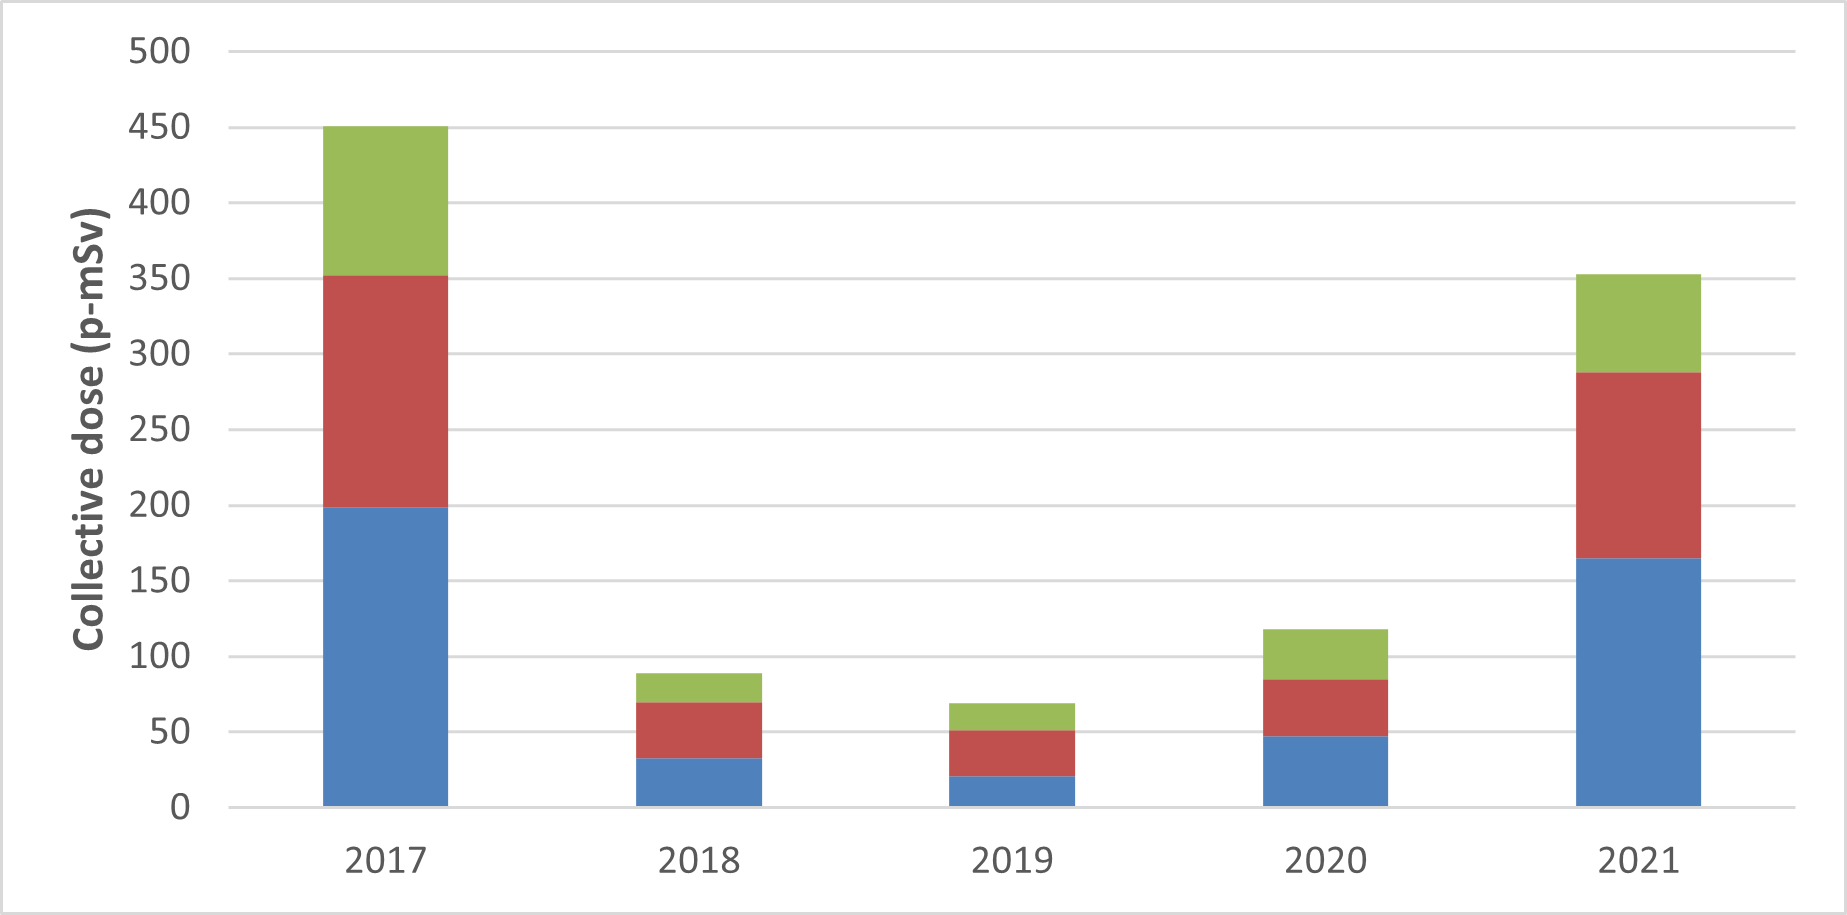
Figure 6.3: Text version
A graph showing the annual collective effective dose to nuclear energy workers at the Key Lake Operation from 2017 to 2021. The table shows the collective dose values to nuclear energy workers at the Key Lake Operation for the same period.
| 2017 | 2018 | 2019 | 2020 | 2021 | |
|---|---|---|---|---|---|
|
Gamma (p-mSv) |
199 | 33 | 21 | 47 | 165 |
|
RnP
(p-mSv) |
153 | 37 | 30 | 38 | 123 |
|
LLRD (p-mSv) |
99 | 19 | 18 | 33 | 65 |
|
RnG
(p-mSv) |
0 | 0 | 0 | 0 | 0 |
| Total* | 451 | 88 | 69 | 106 | 353 |
RnP = radon progeny; LLRD = long-lived radioactive dust; RnG = radon gas
* The total collective dose may not match the individual components due to rounding errors.
Cameco continued to meet its objectives in 2021 for keeping doses consistent with the ALARA principle at the Key Lake Operation. To support this objective, the radiation area monitoring program was revised for the transition to care and maintenance.
Worker dose control
In 2021, the average individual effective dose to NEWs was 0.52 mSv, while the maximum individual effective dose received was 3.13 mSv. This compares to an average effective dose of 0.35 mSv and a maximum individual dose of 2.11 mSv in 2020. The effective doses received by workers from 2018 to 2021 are lower than historic values because the facility is in a state of care and maintenance.
The person who received the maximum individual effective dose at the Key Lake Operation was identified as a mill maintenance worker. The 5-year dosimetry period of 2021 to 2025 has just started. So far, the maximum dose is 3.13 mSv (~ 3.1% of the regulatory dose limit of 100 mSv dose limit). There were no administrative or action level exceedances in 2021.
Based on compliance verification activities, such as onsite inspections and the review of the licensee’s reports, work practices, monitoring results and individual effective dose results, CNSC staff were satisfied that the Key Lake Operation continued to be effective at controlling radiation doses to workers in 2021.
6.3 Environmental protection
For 2021, CNSC staff continued to rate the environmental protection SCA as “satisfactory” based on regulatory oversight activities. CNSC staff concluded that the licensee’s environmental protection program was effectively implemented and met all regulatory requirements.
| 2017 | 2018 | 2019 | 2020 | 2021 |
|---|---|---|---|---|
| SA | SA | SA | SA | SA |
SA = satisfactory
Environmental management system
The environmental management system at the Key Lake Operation includes activities such as establishing annual environmental objectives, goals and targets. Cameco conducts internal audits of its environmental protection program at the Key Lake Operation, as identified in its CNSC-approved management system program. CNSC staff review and assess the objectives, goals and targets through regular compliance verification activities. CNSC staff noted that Cameco continued to carry out routine inspections, internal audits, environmental training, and periodic reviews of environmental monitoring data. These activities were conducted to verify continual improvement and to confirm that the controls put in place to protect the environment are effective.
Effluent and emissions control
Treated effluent released to the environment
At the Key Lake Operation, 2 effluent streams are processed in separate treatment facilities before being released to the environment:
- The mill effluent is processed with a treatment system of chemical precipitation and liquid/solid separation, then released to Wolf Lake in the David Creek system.
- Effluent from dewatering wells of the Gaertner pit and Deilmann pit hydraulic containment systems is treated with a reverse osmosis system before being released to Horsefly Lake in the McDonald Lake system.
Monitoring confirmed that the effluent from dewatering wells was within design specifications and the predictions outlined in the ERA. Effluent from the reverse osmosis system was in compliance with regulatory limits and there were no environmental action level exceedances.
The treated effluent quality presented in table 6.2 refers only to the mill effluent as released to the David Creek system. CNSC staff verified that the concentration of all regulated contaminants in the treated mill effluent released in 2021 met regulatory limits. There were no exceedances of environmental action levels.
As discussed in section 2.3, the constituents of potential concern (COPCs) in treated effluent at uranium mine and mill operations with the potential to adversely affect the environment are molybdenum, selenium and uranium (see figures 2.5 to 2.7). Of these, molybdenum and selenium concentrations were the primary concerns at the Key Lake Operation. The licensee previously completed process changes to reduce concentrations in treated effluent.
Reductions of molybdenum and selenium occurred from 2007 to 2009, when additional treatment components were installed and optimized. Figures 2.5 and 2.6 (section 2) show stable or declining concentrations of molybdenum and selenium in treated effluent from 2017 to 2021, indicating that these parameters are being effectively controlled. Cameco submitted a molybdenum and selenium follow-up program closure report in 2018. Based on the results of the follow-up program, Cameco suggested that current regulatory monitoring requirements were sufficient to monitor future changes in sediment and other environmental receptors and proposed that the formal follow-up program cease. CNSC staff confirmed in 2019 that the follow-up program could conclude, and, as a result, the monitoring requirements were added to the facility’s environmental monitoring program.
Figure 2.7 (section 2) shows that uranium concentrations in treated effluent released from the Key Lake mill remain low and are effectively controlled. In addition to analyzing treated effluent for uranium, molybdenum and selenium, Cameco analyzed treated effluent at Key Lake for concentrations of other COPCs, such as radium-226, arsenic, copper, lead, nickel, zinc, total suspended solids (TSS) and pH. As discussed in section 2.4, the Key Lake Operation continued to meet MDMER [Footnote 8 discharge limits.
CNSC staff will continue to review effluent quality results to verify that the treatment of effluent remains effective.
Air emissions released to the environment
The air and terrestrial monitoring program at the Key Lake Operation includes ambient monitoring for sulphur dioxide, radon and total suspended particulate (TSP), as well as soil and lichen sampling to assess air quality. Air emissions monitoring from the mill stacks is also included in the air quality monitoring program.
The Key Lake calciner stack was not sampled in 2021 because the facility was not in operation. Sulphur dioxide concentrations from the acid plant stack are monitored daily when in operation; however, the plant did not operate in 2021.
Radon in air around the Key Lake Operation is monitored at 5 stations using passive track-etch cups. Figure 6.4 shows the average concentrations of radon in ambient air from 2017 to 2021. Ambient radon concentrations were typical of the northern Saskatchewan regional background of less than 7.4 Bq/m3 to 25 Bq/ m3. The measured radon concentrations were also below the reference radon concentration of 60 Bq/m3, which is equal to an incremental dose of 1 mSv per year above background.
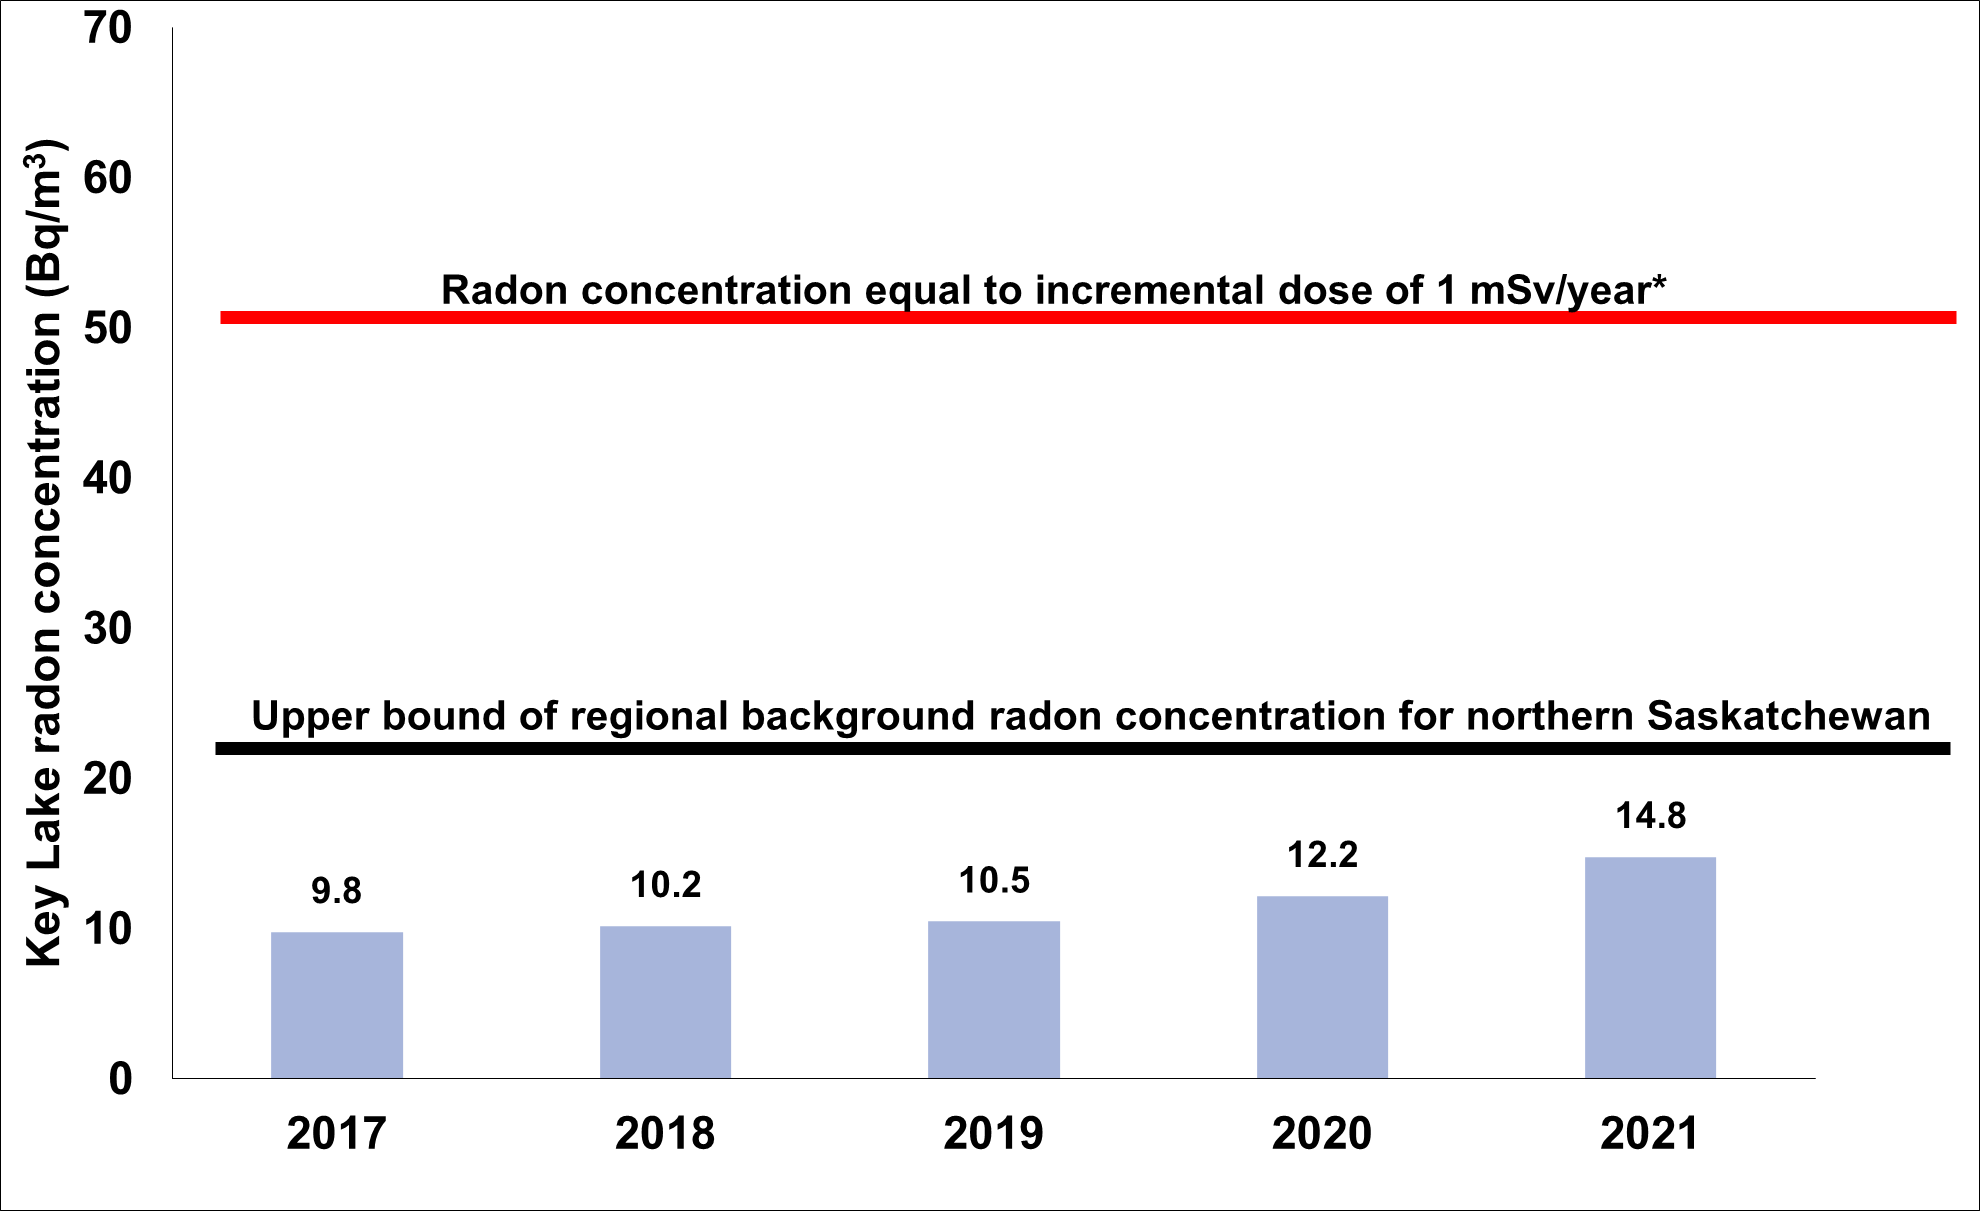
Figure 6.4: Text version
A graph showing the average concentration of radon gas in ambient air at the Key Lake Operation from 2017 to 2021. The upper bound of regional background radon concentration for Northern Saskatchewan is 24 Becquerels per meter cubed. The radon concentration equal to an incremental dose of 1 millisievert per year is 55 Becquerels per meter cubed.
| 2017 | 2018 | 2019 | 2020 | 2021 | |
| Radon concentrations (Bq/m3) | 9.8 | 10.2 | 10.5 | 12.2 | 14.8 |
* Upper bound of the incremental dose of 1 mSv per year above background (i.e., an incremental radon concentration of 30 Bq/m3 above natural background), based on International Commission on Radiological Protection (ICRP) Publication 115, Lung Cancer Risk from Radon and Progeny and Statement on Radon. Values are calculated as geometric means.
Five high-volume air samplers were used to collect and measure TSP. The TSP levels are below the Province of Saskatchewan’s authorized concentration of contaminants monitored for ambient air quality, as listed in the facility’s approval to operate pollutant control facilities. TSP samples are also analyzed for concentrations of metals and radionuclides. The mean concentrations of metal and radionuclides adsorbed to TSP were low and were below the reference annual air quality levels, as identified in table 6.2.
| Parameter | Reference annual air quality levels* | 2017 | 2018 | 2019 | 2020 | 2021 |
|---|---|---|---|---|---|---|
|
TSP (µg/m3) |
60 (3) | 11.90 | 8.80 | 6.91 | 6.04 | 7.00 |
|
As (µg/m3) |
0.06 (1) | 0.0045 | 0.0021 | 0.0021 | 0.0008 | 0.0021 |
|
Ni (µg/m3) |
0.04 (1) | 0.0029 | 0.0011 | 0.0017 | 0.0006 | 0.0015 |
|
Pb-210 (Bq/m3) |
0.021 (2) | 0.0004 | 0.0002 | 0.003 | 0.0002 | 0.0002 |
|
Ra-226 (Bq/m3) |
0.013 (2) | 0.0003 | 0.0001 | 0.0001 | 0.0001 | 0.0001 |
|
Th-230
(Bq/m3) |
0.0085 (2) | 0.0002 | 0.0001 | 0.0001 | 0.0001 | 0.0001 |
|
U (µg/m3) |
0.06 (1) | 0.0085 | 0.0012 | 0.0008 | 0.0002 | 0.0056 |
1 Reference annual air quality levels derived from Ontario’s 24-hour Ambient Air Quality Criteria (2012).
2 Reference level from International Commission on Radiological Protection (ICRP) Publication 96, Protecting People Against Radiation Exposure in the Event of a Radiological Attack.
3 Saskatchewan Environmental Quality Guidelines, Table 20: Saskatchewan Ambient Air Quality Standards. Values are calculated as geometric means.
* Reference levels are based on Province of Ontario Ambient Air Quality Criteria and are shown for reference only. No federal or Saskatchewan provincial limits were established at the time of this report.
A sulphur dioxide monitor is located approximately 300 metres downwind of the mill facility and is used to continuously measure the ambient sulphur dioxide associated with mill emissions. Because the site has been in a state of care and maintenance, CNSC staff and the Saskatchewan Ministry of Environment granted approval to cease ambient sulphur dioxide monitoring. Monitoring will be required when the acid plant resumes operation.
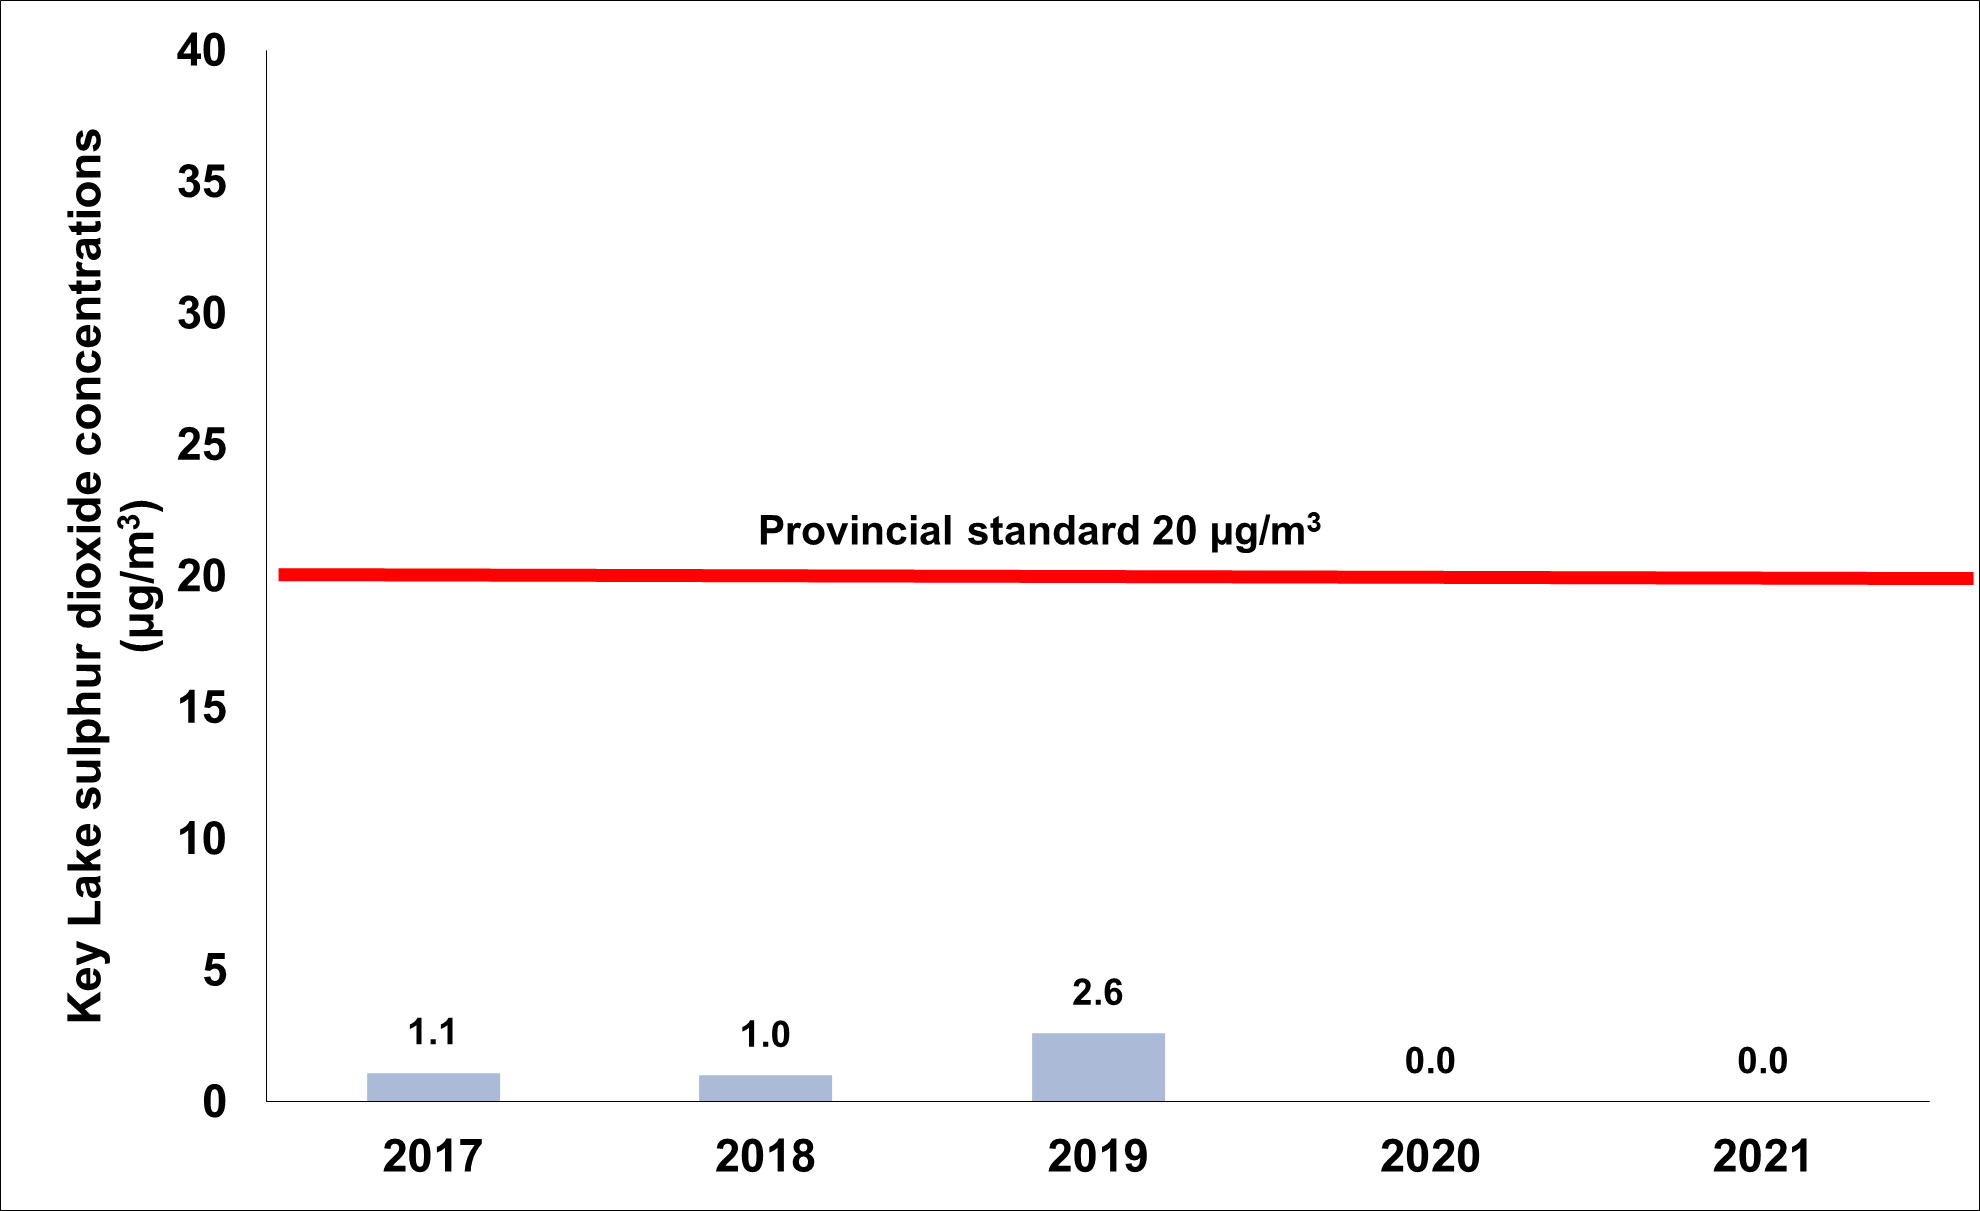
Figure 6.5: Text version
A graph showing the average concentration of sulphur dioxide in ambient air at the Key Lake Operation from 2017 to 2021. The provincial standard is 20 micrograms per meter cubed.
| 2017 | 2018 | 2019 | 2020 | 2021 | |
| Sulphur dioxide concentrations (µg/m3) | 1.1 | 1.0 | 2.6 | 0.0 | 0.0 |
* Monitoring temporarily suspended in 2020 due to shut-down of acid plant during care and maintenance period.
In addition to ambient air monitoring for sulphur dioxide, sulphate levels have been monitored in 4 lakes to measure the effects of sulphur dioxide emissions from the operation. The results of the 2021 lake sampling program continued to show that sulphate concentrations remain relatively unchanged from historical concentrations. CNSC staff concluded that the operations at Key Lake and the resulting sulphur dioxide emissions do not have an adverse effect on the sulphate levels in nearby lakes.
Soil and terrestrial vegetation may be affected by atmospheric deposition of particulate, adsorbed metals and radionuclides associated with onsite activities. The terrestrial monitoring program in place includes measurements of metals and radionuclides in soil and in lichen. Lichen and soil samples were collected in 2021.
There were no significant differences in total lichen richness observed between 2011 and 2021. The similarity in results from the past decade indicate that species abundance has not been affected by the SO2 emissions 4 km downwind of the Key Lake Operation. Overall epiphytic lichens were observed to be increasing in abundance and richness, a sign of a healthy epiphytic lichen community.
The 2021 lichen chemistry data indicate that parameter concentrations tended to be higher at locations in closer proximity to the operation as compared to locations farther from site. Levels of arsenic, nickel and uranium are generally declining with time, and 2021 saw some of the lowest levels reported to date. In addition, levels of radionuclides have been relatively low over time, with some parameters showing the lowest recorded levels to date in 2021. Results from the 2016 soil sampling program illustrate that parameter concentrations at all stations were comparable to, or lower than, historical results, with the exception of lead‑210 and polonium-210, which increased in 2016 but returned to lower levels during the 2021 sampling period.
Uncontrolled releases
In 2021, there were 4 events reported to CNSC staff that were considered to be releases of hazardous substances to the environment:
- On February 12, 2021, approximately 3,000 litres of contaminated water was released to the ground from a valve shack adjacent to the Deilmann TMF. A split in a 3-inch pipe occurred as a result of the extreme cold temperatures. The contaminated water was largely recovered using a vacuum truck.
- On June 22, 2021, Cameco notified CNSC staff of the discovery of elevated concentrations of COPCs, specifically ammonia and sulfate, in groundwater samples from monitoring wells MT‑19‑01 and MT‑19‑12, taken as part of the 2020 and 2021 sampling program for these wells. The wells were installed as part of the site assessment resulting from the 2018 reportable discharge from the molybdenum plant (refer to CMD 19-M13 Footnote 13 and CMD 19-M36 Footnote 14). It was deemed likely that a release to the environment occurred before Key Lake went into a state of care and maintenance in 2018 and that the elevated concentrations were not solely the result of previously reported historical discharges or discoveries at Key Lake. An update on the status of the 2018 and 2021 discoveries are included below.
- On September 13, 2021, an unknown quantity of propane was released from a leak on the propane line outside the leaching building at the mill. A mill operator conducting their inspection/rounds reported the smell of propane. The insultation cover on the propane piping had deteriorated and corrosion had developed on a pipe, which eventually led to the leak.
- On December 27, 2021, over 60 litres of propane was released from the propane storage area near the steam plant. A pressure gauge on the pipe near the propane pump broke, resulting in the release. The powerhouse operator was alerted by an alarm and responded.
Appendix I provides a brief description of each release and the actions taken by the licensee. With the exception of the groundwater contamination discovery (see below), all corrective actions related to these spills have been completed and have been accepted by CNSC staff.
In 2018, Cameco was required to complete an investigation and develop a corrective action plan after the discovery of uranium contamination in groundwater under the mill terrace. A site assessment report was prepared and was submitted to the CNSC in March 2020. The assessment confirmed that the uranium contamination was limited in geographic extent; there have been no impacts and no immediate risks to the surrounding environment. The assessment included source sampling, monitoring, borehole well installation, groundwater sampling, and hydraulic conductivity testing. The assessment was used to develop a corrective action plan, which was submitted in September 2020. CNSC staff accepted that plan in June 2021, with the remediation involving the installation of recovery wells to pump out and treat the contaminated groundwater. As part of the corrective action plan, Cameco drilled groundwater recovery wells and completed pump flow testing, and conducted 2 rounds of water quality sampling in 2021. Cameco anticipates that the installation and commissioning of the recovery wells will be completed in the fourth quarter of 2022. The environment remains protected while the remediation proceeds.
As part of the site assessment related to the 2018 uranium in groundwater event, Cameco installed and sampled several new wells. Water quality results from 2 of these newly installed wells showed elevated contaminant levels, including for ammonia and sulphate. These wells are also located on the mill terrace. The elevated levels are not associated with the 2018 uranium in groundwater event; they are thought to be from a separate discharge that occurred sometime before the facility went into care and maintenance. Cameco notified CNSC staff of these findings in June 2021, and it continues to provide updates. The information provided by Cameco to date indicates that this new contamination is still limited to the mill terrace and that the environment remains protected. Cameco submitted another site assessment report in response to the discovery on May 17, 2022.
Figure 2.10 ( section 2) shows the number of reportable environmental spills and the number of releases of hazardous material to the environment from the licensed activities at the Key Lake Operation from 2017 to 2021.
Assessment and monitoring
CNSC staff confirmed that the licensee, in accordance with the Key Lake environmental protection program, successfully carried out the required environmental monitoring.
Through the compliance activities carried out and the review of annual reports and environmental protection reports (EPRs), CNSC staff concluded that the environmental monitoring conducted at the Key Lake Operation met regulatory requirements. Consequently, CNSC staff concluded that the environment remains protected.
Environmental risk assessment
The Key Lake Operation EPR and updated environmental risk assessment (ERA) for 2015 to 2019 were submitted to the CNSC and the Saskatchewan Ministry of Environment in December 2020. CNSC staff reviewed the environmental monitoring results for air, soil, vegetation, surface water, groundwater and sediment, as well as the health indicators for fish and their prey inhabiting sediment, and confirmed that the results were within those predicted in the ERA.
After reviewing the EPR and ERA, CNSC staff concluded that adequate measures have been taken at the Key Lake Operation to protect human health and the environment.
Protection of people
Cameco is required to demonstrate that the health and safety of the public are protected from exposures to hazardous substances released from the Key Lake Operation. The effluent and environmental monitoring programs currently conducted by the licensee are used to verify that releases of hazardous substances do not result in environmental concentrations that may affect public health.
The CNSC receives reports of discharges to the environment through the reporting requirements outlined in the Key Lake licence and licence conditions handbook (LCH). A review of the hazardous (non-radiological) discharges to the environment indicates that the public and the environment are protected. CNSC staff confirmed that environmental concentrations in the vicinity of the Key Lake Operation remained within those predicted in the 2013 ERA and that human health and the environment remained protected in 2021.
Based on compliance verification activities, such as inspections and the review of the licensee’s reports, work practices, and monitoring results for 2021, CNSC staff concluded that the Key Lake Operation’s environmental protection program continued to be effective at protecting the public and the environment.
6.4 Conventional health and safety
For 2021, CNSC staff continued to rate the conventional health and safety SCA as “satisfactory” based on regulatory oversight activities.
| 2017 | 2018 | 2019 | 2020 | 2021 |
| SA | SA | SA | SA | SA |
SA = satisfactory
Practices
The Key Lake Operation’s incident reporting system records health- and safety-related events and uses several layers of review in investigations. Corrective measures are tracked and assessed for effectiveness before the incident record is closed. The Key Lake Operation continued its planned health and safety inspection program in 2021. Any items of concern found during the inspections are included in the licensee’s incident reporting system.
Performance
Table 6.3 summarizes the lost-time injuries (LTIs) at the Key Lake Operation between 2017 and 2021. There were no LTIs at the Key Lake Operation during that period.
The TRIR for Key Lake is included for the last 5 years. The TRIR is the incident frequency rate that measures the number of fatalities, LTIs and other injuries requiring medical treatment.
| 2017 | 2018 | 2019 | 2020 | 2021 | |
|---|---|---|---|---|---|
| Lost-time injuries1 | 0 | 0 | 0 | 0 | 0 |
| Severity rate2 | 0 | 0 | 0 | 0 | 0 |
| Frequency rate3 | 0 | 0 | 0 | 0 | 0 |
| Total recordable incident rate4 | 3.48 | 2.59 | 2.22 | 2.04 | 1.33 |
1 An injury that takes place at work and results in the worker being unable to return to work for a period of time.
2 A measure of the total number of days lost to injury for every 200,000 person-hours worked at the facility. Accident severity rate = [(# of days lost in last 12 months) / (# of hours worked in last 12 months)] x 200,000.
3 A measure of the number of LTIs for every 200,000 person-hours worked at the facility. Accident frequency rate = [(# of injuries in last 12 months) / (# of hours worked in last 12 months)] x 200,000.
4 A measure of the number of fatalities, LTIs and other injuries requiring medical treatment for every 200,000 person-hours worked at the facility. Recordable incident rate = [(# of incidents in last 12 months) / (# of hours worked in last 12 months)] x 200,000.
Awareness
CNSC staff evaluated Cameco’s conventional health and safety program at Key Lake and determined that it continued to provide education, training, tools and support to workers. The idea that safety is the responsibility of all individuals is promoted by the licensee’s managers, supervisors and workers. The licensee’s management stresses the importance of conventional health and safety through regular communication, management oversight and continual improvement of safety systems.
CNSC staff’s compliance verification activities concluded that Cameco’s health and safety program at the Key Lake Operation met regulatory requirements in 2021.
6.5 Additional SCAs
In this 2021 regulatory oversight report, CNSC staff have provided a brief discussion of the additional SCAs; these are presented in the following sections.
6.5.1 Management system
The licensee maintains a quality management program; this forms part of the licensing basis for the Key Lake Operation in the LCH.
There were no inspections at the Key Lake Operation that focused on evaluating the management system SCA in 2021 and no event reports for which this SCA was the main contributory factor.
CNSC staff concluded that the licensee’s program in respect of this SCA remains satisfactory.
6.5.2 Human performance management
The licensee includes program documentation for the human performance management SCA as part of the overall management system documents; these form part of the licensing basis for the Key Lake Operation in the LCH.
There were no inspections at the Key Lake Operation that focused on evaluating the human performance SCA in 2021 and no event reports for which this SCA was the main contributory factor.
CNSC staff concluded that the licensee’s program in respect of this SCA remains satisfactory.
6.5.3 Operating performance
The licensee includes program documentation for the operating performance SCA as part of the overall management system documents; these form part of the licensing basis for the Key Lake Operation in the LCH.
There were no inspections at the Key Lake Operation that focused on evaluating the operating performance SCA in 2021 and no event reports for which this SCA was the main contributory factor.
CNSC staff concluded that the licensee’s program in respect of this SCA remains satisfactory.
6.5.4 Safety analysis
The licensee includes program documentation for the safety analysis SCA as part of the overall management system documents; these form part of the licensing basis for the Key Lake Operation in the LCH.
There were no inspections at the Key Lake Operation that focused on evaluating the safety analysis SCA in 2021 and no event reports for which this SCA was the main contributory factor.
CNSC staff concluded that the licensee’s program in respect of this SCA remains satisfactory.
6.5.5 Physical design
The licensee includes program documentation for the physical design SCA as part of the overall management system documents; these form part of the licensing basis for the Key Lake Operation in the LCH.
There were no inspections at the Key Lake Operation that focused on evaluating the physical design SCA in 2021 and no event reports for which this SCA was the main contributory factor.
CNSC staff concluded that the licensee’s program in respect of this SCA remains satisfactory.
6.5.6 Fitness for service
The licensee includes program documentation for the fitness for service SCA as part of the overall management system documents; these form part of the licensing basis for the Key Lake Operation in the LCH.
There were no inspections at the Key Lake Operation that focused on evaluating the fitness for service SCA and no event reports for which this SCA was the main contributory factor.
CNSC staff concluded that the licensee’s program in respect of this SCA remains satisfactory.
6.5.7 Emergency management and fire protection
The licensee includes program documentation for the emergency management and fire protection SCA as part of the overall management system documents; these form part of the licensing basis for the Key Lake Operation in the LCH.
There were no inspections at the Key Lake Operation that focused on evaluating the emergency management and fire protection SCA in 2021 and no event reports for which this SCA was the main contributory factor.
CNSC staff concluded that the licensee’s program in respect of this SCA remains satisfactory.
6.5.8 Waste management
The licensee includes program documentation for the waste management SCA as part of the overall management system documents; these form part of the licensing basis for the Key Lake Operation in the LCH.
There were no inspections at the Key Lake Operation that focused on evaluating the waste management SCA in 2021 and no event reports for which this SCA was the main contributory factor.
CNSC staff concluded that the licensee’s program in respect of this SCA remains satisfactory.
6.5.9 Security
The licensee includes program documentation for the security SCA as part of the overall management system documents; these form part of the licensing basis for the Key Lake Operation in the LCH.
There were no inspections at the Key Lake Operation that focused on evaluating the security SCA in 2021 and no event reports for which this SCA was the main contributory factor.
CNSC staff concluded that the licensee’s program in respect of this SCA remains satisfactory.
6.5.10 Safeguards and non-proliferation
The licensee includes program documentation for the safeguards and non‑proliferation SCA as part of the overall management system documents; these form part of the licensing basis for the Key Lake Operation in the LCH.
There were no inspections at the Key Lake Operation that focused on evaluating the safeguards and non-proliferation SCA in 2021. There were no notices of non‑compliance related to the safeguards and non-proliferation SCA and no event reports for which this SCA was the main contributory factor.
In addition to CNSC compliance activities relating to the specific areas under the safeguards and non-proliferation SCA, the International Atomic Energy Agency (IAEA) conducts independent inspections, with coordination and support provided through the CNSC regulatory framework. No IAEA inspections were conducted at the Key Lake Operation in 2021.
CNSC staff concluded that the licensee’s program in respect of this SCA remains satisfactory.
6.5.11 Packaging and transport
The licensee includes program documentation for the packaging and transport SCA as part of the overall management system documents; these form part of the licensing basis for the Key Lake Operation in the LCH.
There were no inspections at the Key Lake Operation that focused on evaluating the packaging and transport SCA in 2021. No shipments of ore concentrate were sent from Key Lake in 2021. In addition, there were no event reports for which this SCA was the main contributory factor.
CNSC staff concluded that the licensee’s program in respect of this SCA remains satisfactory.
7 McClean Lake Operation
Orano Canada Inc. (Orano) is the operator of the McClean Lake Operation. The McClean Lake Operation is a uranium mine and mill facility located approximately 750 kilometres north of Saskatoon, in the Athabasca Basin of northern Saskatchewan. The McClean Lake Operation includes the John Everett Bates (JEB) milling area, Sue mining area, JEB tailings management facility (TMF), and the undeveloped McClean, Midwest and Caribou ore deposits. An aerial view of the facility is presented in figure 7.1.
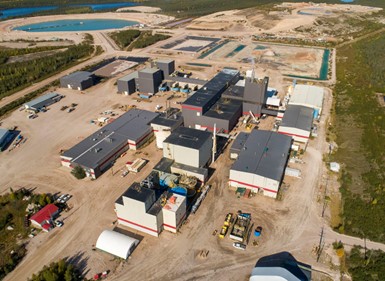
Source: Orano
CNSC staff confirmed that the McClean Lake Operation’s production did not exceed the authorized annual production limit.
Though there were no conventional mining activities at the McClean Lake Operation in 2021, the Surface Access Borehole Resource Extraction (SABRE) program was successfully completed during a test mining session in 2021. Table 7.1 presents mining data for the McClean Lake Operation from SABRE for the 5-year reporting period.
| Mining | 2017 | 2018 | 2019 | 2020 | 2021 |
|---|---|---|---|---|---|
|
Ore tonnage (Mkg/year) |
N/A | N/A | N/A | N/A | 1.21 |
| Average ore grade mined (% U) | N/A | N/A | N/A | N/A | 5.66 |
|
Uranium mined (Mkg U/year) |
N/A | N/A | N/A | N/A | 0.058 |
The primary ore source for the McClean Lake mill was the ore slurry from the Cigar Lake Mine, while a separate smaller stream of McClean Lake Joint Venture ore, through the SABRE program, was co-milled in October and November. Table 7.2 presents milling production data for the McClean Lake Operation for the 5‑year reporting period.
| Milling | 2017 | 2018 | 2019 | 2020 | 2021 |
|---|---|---|---|---|---|
| Mill ore feed (Mkg/year) | 36.35 | 42.9 | 46.2 | 26.3 | 35.2 |
| Average annual mill feed grade (% U) | 19.30 | 16.26 | 15.15 | 14.56 | 13.82 |
| Percentage of uranium recovery (%) | 99.03 | 98.94 | 98.91 | 98.81 | 98.7 |
| Uranium concentrate produced (Mkg U) | 6.93 | 6.94 | 6.94 | 3.88 | 4.75 |
| Authorized annual production (Mkg U/year) | 9.23 | 9.23 | 9.23 | 9.23 | 9.23 |
Licence amendments
Following a public hearing on June 7 and 8, 2017, in La Ronge, Saskatchewan, the current operating licence was renewed on July 1, 2017, and expires on June 30, 2027. The Commission amended the McClean Lake operating licence on July 1, 2018, to reflect the licensee’s corporate name change from AREVA Resources Canada Inc. to Orano Canada Inc.
Orano has stated that milling of Cigar Lake ore produced more tailings per tonne of ore processed than initially expected. Current mining and milling plans indicate that the JEB TMF will reach its full storage capacity in 2027. In order for Orano to secure future mining and milling plans, sufficient tailings capacity must be available to prevent production disruptions. Therefore, Orano submitted an application to amend the CNSC-issued uranium mine operating licence UMOL-MINEMILL-McCLEAN.01/2027 for the expansion of the JEB TMF at the McClean Lake Operation Footnote 15. This expansion would increase the JEB TMF embankment height to 468 metres above sea level (mASL) and the consolidated tailings to 462 mASL, resulting in an increase of 10.5 metres in embankment height and of 14 metres in the consolidated tailings elevation. After a public hearing on October 4, 2021, the Commission amended the CNSC licence for the McClean Lake Operation to allow the JEB TMF expansion. The Commission also approved Orano’s revised financial guarantee of $102,098,000 for the McClean Lake Operation Footnote 16.
7.1 Performance
The SCA ratings at the McClean Lake Operation for the 5-year period from 2017 to 2021 are shown in appendix E. For 2021, CNSC staff rated all SCAs as “satisfactory” based on regulatory oversight activities.
In 2021, CNSC staff carried out 6 inspections that covered multiple SCAs, including 2 focused inspections (human performance management, and packaging and transport) and 1 reactive inspection (related to the JEB TMF expansion), as detailed in appendix B.
For the 2021 calendar year, 5 instances of non-compliance were noted during CNSC inspections at the McClean Lake Operation. These instances of non‑compliance were of low safety significance and related to the human performance management and the packaging and transport SCAs. The licensee implemented corrective actions, which were reviewed and accepted by CNSC staff. A list of inspections can be found in appendix B.
This report covers all SCAs but focuses on the 3 SCAs that cover many of the key performance indicators for these mines and mills: radiation protection, environmental protection, and conventional health and safety.
7.2 Radiation protection
Based on regulatory oversight activities during the reporting period, CNSC staff rated the radiation protection SCA at McClean Lake as “satisfactory”, as shown in the table below:
| 2017 | 2018 | 2019 | 2020 | 2021 |
|---|---|---|---|---|
| SA | SA | SA | SA | SA |
SA = satisfactory
Radiological hazard control
The source of radiological exposure at the McClean Lake Operation is the milling of high-grade uranium ore received from Cameco’s Cigar Lake mine. The 3 primary dose contributors are gamma radiation (45%), RnP (33%) and LLRD (22%). Gamma radiation hazards are controlled through practices related to the effective use of time, distance and shielding. Effective doses to nuclear energy workers (NEWs) from exposures to RnP and LLRD are controlled through the effective use of source control, ventilation, contamination control and personal protective equipment.
Orano has incorporated specific radiation protection features into its design to process undiluted, high-grade uranium ore at McClean Lake. These design features were established to limit radiological hazards (for all types) to specific design hazard objectives. Orano continues to implement a comprehensive monitoring program for all hazards to confirm that the engineered control of hazards remains effective, verify that design hazard objectives continue to be met, and identify opportunities for improvement at the McClean Lake Operation.
CNSC staff concluded that Orano continued to implement a comprehensive monitoring program and remained highly effective at controlling all radiological hazards at the McClean Lake Operation in 2021.
Radiation protection program performance
In 2021, CNSC staff were satisfied that the radiation protection program and practices at the McClean Lake Operation remained effective at controlling the radiological exposure to workers. The doses to workers remained below regulatory limits and as low as reasonably achievable (ALARA). No exceedances of action levels were reported at the McClean Lake Operation in 2021.
Application of ALARA
In 2021, the collective radiation exposure to NEWs at the McClean Lake Operation was 278 person-millisieverts (p-mSv), a 13% increase from the 2020 value of 246 p‑mSv (figure 7.2). The year-over-year increase in collective dose is attributed to increased mill production days in 2021. The collective radiation exposure in 2021 remained lower than in 2017, 2018 and 2019.

Figure 7.2: Text version
A graph showing the annual collective effective dose to nuclear energy workers at the McClean Lake Operation from 2017 to 2021. The table shows the collective dose values to nuclear energy workers at the McClean Lake Operation for the same period.
| 2017 | 2018 | 2019 | 2020 | 2021 | |
|---|---|---|---|---|---|
|
Gamma (p-mSv) |
122 | 98 | 100 | 124 | 124 |
|
RnP
(p-mSv) |
100 | 122 | 133 | 78 | 93 |
|
LLRD (p-mSv) |
85 | 76 | 67 | 45 | 61 |
|
RnG
(p-mSv) |
0 | 0 | 0 | 0 | 0 |
| Total* | 307 | 307 | 301 | 246 | 278 |
RnP = radon progeny; LLRD = long-lived radioactive dust; RnG = radon gas
* The total collective dose may not match the individual components due to rounding errors.
Through reviews of radiation monitoring, exposure reports and inspections, CNSC staff confirmed that the radiation protection program was highly effective and verified that worker exposures remained consistent with the ALARA principle in 2021.
Worker dose control
In 2021, the average individual effective dose to NEWs was 0.79 mSv, while the maximum individual effective dose received by a NEW was 4.89 mSv. These values compare to an average individual effective dose of 0.67 mSv and a maximum individual dose of 4.28 mSv in 2020. All individual effective doses received by NEWs were well below the CNSC’s regulatory dose limit of 50 mSv in a 1-year dosimetry period. The 5-year dosimetry period of 2021 to 2025 has just started. So far, the maximum dose is 4.89 mSv (~5% of the regulatory dose limit of 100 mSv).
Based on Orano’s compliance verification activities, such as inspections and the review of the licensee’s reports, work practices, monitoring results, and individual effective dose results in 2021, CNSC staff were satisfied that the McClean Lake Operation continued to be effective at controlling radiation doses to workers in 2021.
7.3 Environmental protection
For 2021, CNSC staff continued to rate the environmental protection SCA as “satisfactory” based on regulatory oversight activities. CNSC staff concluded that the licensee’s environmental protection program was effectively implemented and met all regulatory requirements.
| 2017 | 2018 | 2019 | 2020 | 2021 |
|---|---|---|---|---|
| SA | SA | SA | SA | SA |
SA = satisfactory
Environmental management system
The environmental management system at the McClean Lake Operation includes activities such as establishing annual environmental objectives, goals and targets. Orano conducts internal audits of its environmental management program at the McClean Lake Operation, as identified in its CNSC-approved management system program. CNSC staff review and assess the objectives, goals and targets through regular compliance verification activities. CNSC staff noted that Orano continued to carry out routine inspections, internal audits, environmental training, and periodic reviews of environmental monitoring data. These activities were conducted to verify continual improvement and to confirm that the controls put in place to protect the environment are effective.
Effluent and emissions control
Effluent and emissions monitoring programs serve to demonstrate that the facility’s emissions, wastes, tailings and effluent discharges of nuclear and hazardous substances are properly controlled at the McClean Lake Operation.
Treated effluent released to the environment
At the McClean Lake Operation, 2 effluent streams are processed in separate treatment facilities before being released to the environment:
The mill effluent is processed at the JEB water treatment plant with a treatment system of chemical precipitation and liquid/solid separation. Treated water is released to the Sink/Vulture treated effluent management system.
The Sue water treatment plant treats effluent, which is pumped to control the water level from the mined-out open pits using a chemical precipitation and settling pond clarification process. This effluent is then released to the Sink/Vulture treated effluent management system.
The blended treated effluent is then released in a controlled manner.
The 2016 ERA identified future potential risks to aquatic organisms in McClean Lake east due to exposure to selenium from the milling of Cigar Lake ore. In the Regulatory Oversight Report for Uranium Mines, Mills, Historic and Decommissioned Sites in Canada: 2017 Footnote 10, CNSC staff reported on the selenium adaptive management plan developed and implemented by Orano. CNSC staff continue to review reported selenium concentrations in effluent through quarterly reports to verify that the receiving environment remains protected.
In April 2020, the CNSC requested that Orano propose a long-term solution for sustained reduction of selenium loading to the environment. In response, Orano submitted an update to the selenium adaptive management plan in September 2020, which provides an assessment of treatment technologies as well as the preferred option of the use of ferrous sulphate treatment technology. In October 2021, Orano submitted an implementation plan for the ferrous sulphate treatment at the JEB water treatment plant for enhanced selenium removal, which will be operational in September 2022. CNSC staff will continue to monitor to ensure that the 12-month rolling average selenium loadings remain below the environmentally based reference level (EBRL) of 112 g/day. CNSC staff confirmed that selenium loadings in 2021 were below the EBRL.
Orano reported 1 action level exceedance of 25 mg/L for TSS, in excess of the MDMER discharge limit of 22.5 mg/L. All pond fill samples for the effluent associated with the discharge had TSS concentrations well below the administrative level of 4 mg/L. The probable cause for the apparent action level exceedance was sample contamination, most likely due to iron-based scale from piping getting into the sampling line. The sampling station was cleaned and a standard for cleanliness and maintenance of the sampling port was implemented.
Orano analyzed treated effluent for concentrations of various substances, such as radium‑226, arsenic, copper, lead, nickel, zinc and TSS, and verified pH levels at McClean Lake. As discussed in section 2.3, the McClean Lake Operation continued to meet the discharge limits set out in the MDMER Footnote 8.
CNSC staff will continue to review results on the quality of effluent in order to verify that the treatment of effluent remains effective.
Air emissions released to the environment
Air quality at the McClean Lake Operation is monitored directly by measuring emissions from the mill and the ambient air quality near the operation, and indirectly by measuring metal accumulations in the terrestrial environment.
Air quality monitoring at the McClean Lake Operation includes ambient radon, total suspended particulate (TSP), sulphur dioxide and exhaust stack monitoring. Ambient sulphur dioxide and exhaust stack monitoring were commensurate with the mill commissioning activities and restarted in September 2014. Terrestrial monitoring components include soil and vegetation sampling.
Environmental monitoring for radon concentrations is conducted using the passive method of track-etch cups. There are 23 monitoring stations in various locations around the site-lease boundary. Figure 7.3 shows the average concentrations of radon in ambient air from 2017 to 2021. Ambient radon concentrations were typical of the northern Saskatchewan regional background concentration of less than 7.4 Bq/m3 to 25 Bq/m3. The measured radon concentrations were also below the reference radon concentration of 60 Bq/m3, which is equal to an incremental dose of 1 mSv per year above background.
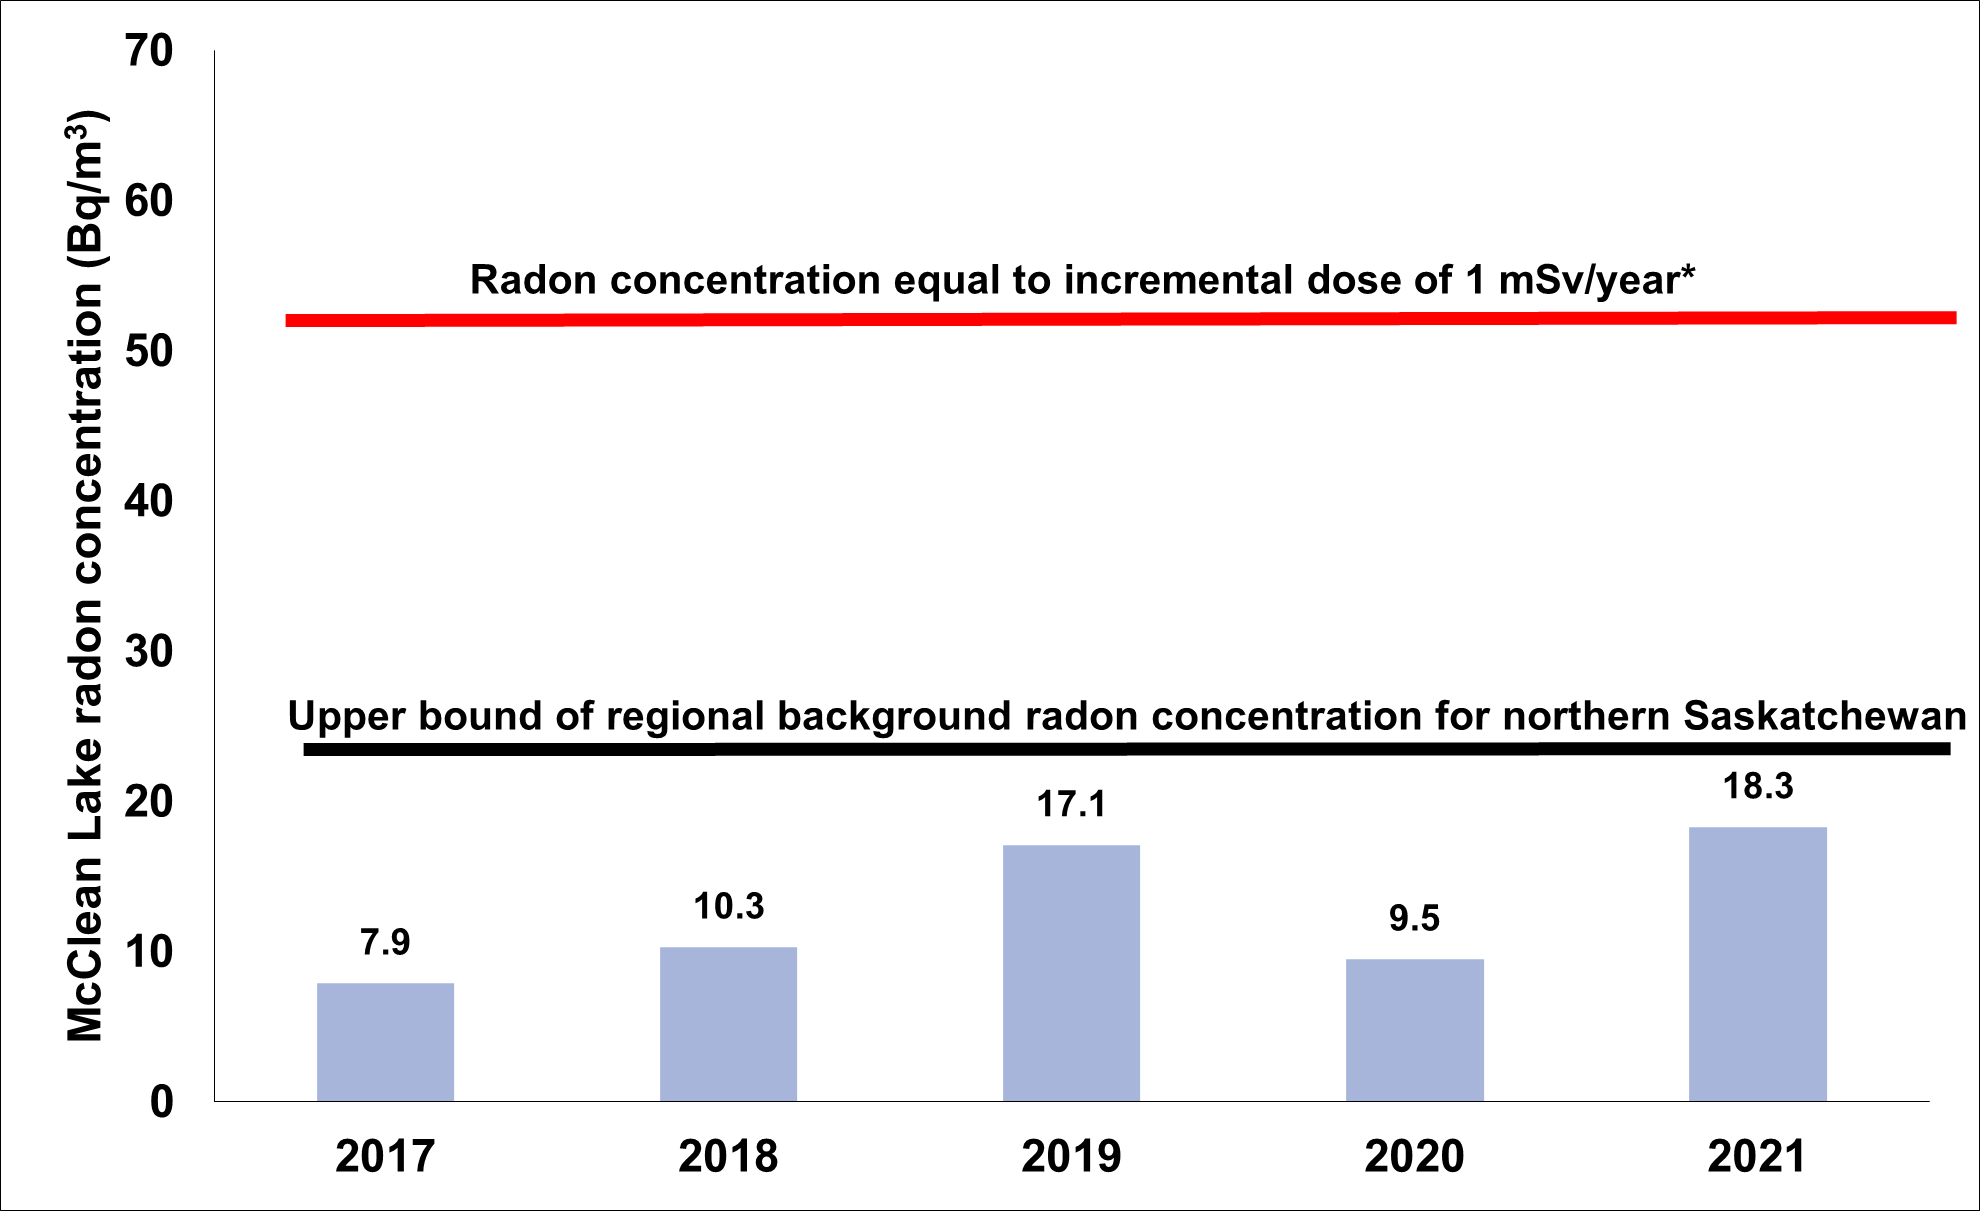
Figure 7.3: Text version
A graph showing the average concentration of radon gas in ambient air at the McClean Lake Operation from 2017 to 2021. The upper bound of regional background radon concentration for Northern Saskatchewan is 29 Becquerels per meter cubed. The radon concentration equal to an incremental dose of 1 millisievert per year is 55 Becquerels per meter cubed.
| 2017 | 2018 | 2019 | 2020 | 2021 | |
|---|---|---|---|---|---|
| Radon concentrations (Bq/m3) | 7.9 | 10.3 | 17.1 | 9.5 | 18.3 |
* Upper bound of the incremental dose of 1 mSv per year above background (i.e., an incremental radon concentration of 30 Bq/m3 above natural background), based on International Commission on Radiological Protection (ICRP) Publication 115, Lung Cancer Risk from Radon and Progeny and Statement on Radon. Values are calculated as geometric means.
Five high-volume air samplers were used to monitor TSP at the McClean Lake Operation. As shown in table 7.2, TSP values remained low in 2021 and well below the provincial standard of 60 µg/m3.
TSP samples were also analyzed for concentrations of metals and radionuclides. The mean concentrations of metal and radionuclides adsorbed to TSP were low and were below the reference annual air quality levels identified in table 7.2.
| Parameter | Reference annual air quality levels* | 2017 | 2018 | 2019 | 2020 | 2021 |
|---|---|---|---|---|---|---|
| TSP (µg/m3) | 60 (3) | 4.96 | 8.00 | 5.00 | 3.24 | 10.26 |
| As (µg/m3) | 0.06 (1) | 0.000432 | 0.000354 | 0.000239 | 0.000122 | 0.000165 |
| Cu (µg/m3) | 9.6 (1) | 0.017159 | 0.018107 | 0.021454 | 0.0367798 | 0.040201 |
| Mo (µg/m3) | 23 (1) | 0.001028 | 0.001154 | 0.001005 | 0.00132060 | 0.000167 |
| Ni (µg/m3) | 0.04 (1) | 0.000321 | 0.000262 | 0.000144 | 0.0001016 | 0.000179 |
| Pb (µg/m3) | 0.10 (1) | 0.000406 | 0.000417 | 0.00025 | 0.0001648 | 0.000281 |
| Zn (µg/m3) | 23 (1) | 0.003165 | 0.004684 | 0.00839 | 0.0025862 | 0.0004419 |
| Pb-210 (Bq/m3) | 0.021 (2) | 0.000309 | 0.000253 | 0.000261 | 0.0002894 | 0.000252 |
| Po-210(Bq/m3) | 0.028 (2) | 0.000100 | 0.000087 | 0.000083 | 0.000087 | 0.000192 |
| Ra-226 (Bq/m3) | 0.013 (2) | 0.000014 | 0.000022 | 0.000022 | 0.000001 | 0.00006 |
| Th-230 (Bq/m3) | 0.0085 (2) | 0.000006 | 0.000004 | 0.000005 | 0.0000052 | 0.000002 |
| U (µg/m3) | 0.06 (1) | 0.002029 | 0.001654 | 0.002497 | 0.000889 | 0.001173 |
1 Reference annual air quality levels are derived from Ontario 24-hour Ambient Air Quality Criteria (2012).
2 Reference level is derived from International Commission of Radiological Protection (ICRP) Publication 96, Protecting People Against Radiation Exposure in the Event of a Radiological Attack.
3 Saskatchewan Environmental Quality Guidelines, Table 20: Saskatchewan Ambient Air Quality Standards. Values are calculated as geometric means.
* Reference levels are based on Province of Ontario Ambient Air Quality Criteria and are shown for reference only. No federal or Saskatchewan provincial limits were established at the time of this report.
A sulphur dioxide monitor is used during operations to continuously measure ambient sulphur dioxide concentrations associated with mill emissions. The monitor is located approximately 200 metres in a predominantly downwind direction of the sulphuric acid plant stack. The measured sulphur dioxide monitoring data (see figure 7.4) showed no exceedances of the annual standard of 20 µg/m3 in 2021.
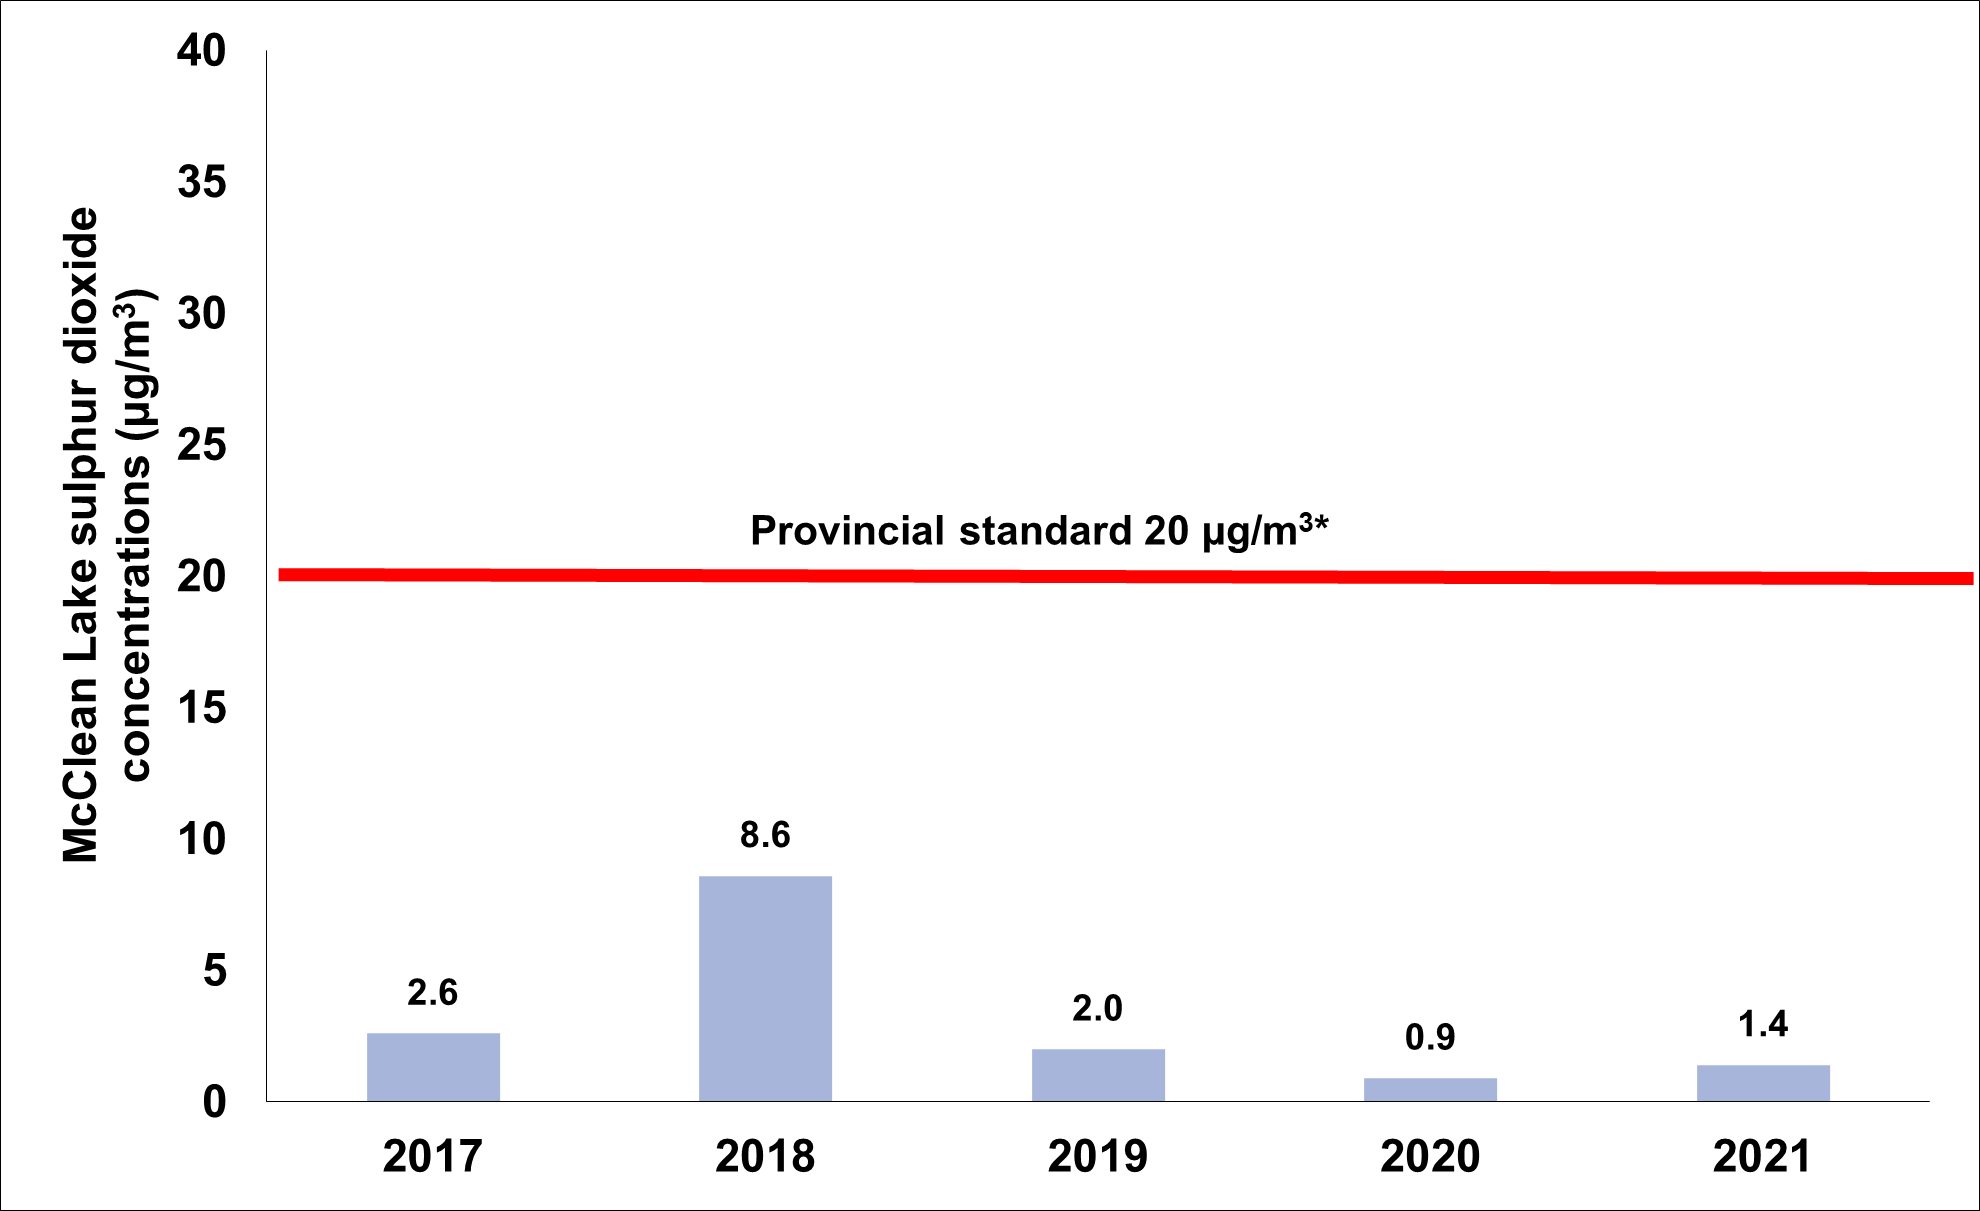
Figure 7.4: Text version
A graph showing the average concentration of sulphur dioxide in ambient air at the McClean Lake Operation from 2017 to 2021. The provincial standard is 20 micrograms per meter cubed.
| 2017 | 2018 | 2019 | 2020 | 2021 | |
|---|---|---|---|---|---|
|
Sulphur dioxide concentrations (µg/m3) |
2.6 | 8.6 | 2.0 | 0.9/1 | 1.4 |
*Province of Saskatchewan’s ambient air quality standard is shown.
Orano’s terrestrial monitoring program at McClean Lake determines whether there is any impact on the environment from aerial deposition. Soil and terrestrial vegetation may be affected by the atmospheric deposition of particulate and adsorbed metals and radionuclides associated with onsite activities. The program includes measurements of metals and radionuclides in soil and vegetation.
Soil monitoring results from soil samples collected in 2015 are presented in the 2016 Technical Information Document – Environmental Performance (TID-EP). The results show that the soil metal parameter concentrations were below the Canadian Environmental Quality Guidelines Footnote 12 set by the Canadian Council of Ministers of the Environment. Radionuclide concentrations in soils were near or at background levels and analytical detection limits. CNSC staff concluded that the level of airborne particulate contaminants produced by the McClean Lake Operation is acceptable and does not pose a risk to the environment.
Vegetation sampling was also presented in the 2016 TID-EP and shows that most parameters are within the range of concentrations previously measured in lichen, Labrador tea and blueberry twig samples. The concentrations of metals and radionuclides in lichen, Labrador tea and blueberry twigs were higher than background concentrations for some samples located in the immediate vicinity of mining and milling activities, although the concentrations decreased within a short distance. Overall, the results indicated that the McClean Lake Operation has had a localized effect on the vegetation in areas of activity.
These higher concentrations were below levels that are toxic to plants, and they decreased to within background concentrations at a short distance from the facility. Therefore, no changes are predicted to terrestrial habitat, both within and outside the facility boundary. The elevated concentrations of contaminants within the facility boundary were modelled in an ERA, and no adverse effects were predicted for terrestrial non-human biota.
In 2021, McClean Lake conducted its terrestrial and aquatic environmental monitoring program. This included sampling of sediment, benthic invertebrates, soil, lichen, vegetation and fish. The results will be included in the 2022 TID-EP.
CNSC staff concluded that the level of airborne particulate contaminants produced by the McClean Lake Operation was acceptable and did not pose a risk to browse (twigs and Labrador tea) and lichen consumers, such as caribou.
Uncontrolled releases
In 2021, 5 events reported to CNSC staff were identified as releases of hazardous substances to the environment:
- On January 29, 2021, approximately 1 m3 of T-Amine 950 reagent was released to the environment while a pallet was being moved.
- On June 9, 2021, approximately 150 m3 of partially treated Sue C pit water was released to the environment because of a hole in the pond liner.
- On October 9, 2021, based on density, approximately 232 kg of tailings solids were released to the environment because the tailings underflow pipeline failed at a valve.
- On November 23, 2021, approximately 10 m3 of reclaim water was released to the environment due to a failed pump rupture disc at the JEB TMF.
- On December 1, 2021, the calciner scrubber was restarted after routine cleaning of the scrubber ducting. Material had loosened during the cleaning process and was discharged from the calciner stack. Approximately 0.7 m3 of material was discharged, which settled to the mill terrace in the immediate vicinity of the calciner building.
All releases were of low safety significance and reporting met the requirements of CNSC REGDOC‑3.2.1, Public Information and Disclosure Footnote 4. Appendix I describes the spills and corrective actions taken. As a result of the actions taken by Orano, the releases caused no residual impacts to the environment and human health. CNSC staff were satisfied with the reporting of releases of hazardous materials to the environment and the corrective actions taken. CNSC staff rated all the 2021 spills as being of low significance.
Figure 2.10 (section 2) shows the number of reportable environmental spills that occurred at the McClean Lake Operation from 2017 to 2021.
Assessment and monitoring
CNSC staff confirmed that the licensee successfully carried out the required environmental monitoring in accordance with the McClean Lake environmental protection program.
Based on compliance activities and the review of annual reports and the 2016 TID-EP, CNSC staff concluded that the environmental monitoring conducted at the McClean Lake Operation met regulatory requirements. Consequently, CNSC staff concluded that the environment and the public remain protected.
Environmental risk assessment
The McClean Lake Operation’s TID-EP, submitted to the CNSC in 2016, contained environmental monitoring data from 2011 to 2015 as well as an updated ERA. CNSC staff reviewed the environmental monitoring results for air, soil, vegetation, surface water, groundwater and sediment, as well as the health indicators for fish and their prey inhabiting sediment, and confirmed that the results were within those predicted in the ERA.
After reviewing the TID-EP and Orano’s ongoing activities to ensure the protection of the environment, CNSC staff concluded that adequate measures have been taken at the McClean Lake Operation to protect the environment.
Protection of people
Orano is required to demonstrate that the health and safety of the public are protected from exposures to hazardous substances released from the McClean Lake Operation. The effluent and environmental monitoring programs currently conducted by the licensee are used to verify that releases of hazardous substances do not result in environmental concentrations that may affect public health.
The CNSC receives reports of discharges to the environment through the reporting requirements outlined in the McClean Lake Operation CNSC-issued licence and LCH. The review of Orano’s hazardous (non-radiological) discharges to the environment at the McClean Lake Operation in 2021 indicated that the public and environment were protected. CNSC staff confirmed that the environmental concentrations in the vicinity of the McClean Lake Operation remained within those predicted in the 2016 ERA, and that human health remained protected.
Based on compliance verification activities, such as inspections and the review of the licensee’s reports, work practices and monitoring results for 2021, CNSC staff concluded that the McClean Lake Operation’s environmental protection program continued to be effective at protecting the public and the environment.
7.4 Conventional health and safety
For 2021, CNSC staff continued to rate the conventional health and safety SCA as “satisfactory” based on regulatory oversight activities.
| 2017 | 2018 | 2019 | 2020 | 2021 |
|---|---|---|---|---|
| SA | SA | SA | SA | SA |
SA = satisfactory
Practices
As required under the Nuclear Safety and Control Act [1], Orano continued to take actions to improve performance and maintain health and safety programs at the McClean Lake Operation to minimize occupational health and safety risks. CNSC staff confirmed that Orano had an effective occupational health and safety committee and that it was completing regular reviews of its safety program at the McClean Lake facility.
Orano’s McClean Lake Operation investigates safety concerns and incidents, including near-miss events. In 2021, several investigations were completed to determine the cause of incidents, near misses, injuries or property damage. The incident investigation process employs a collaborative effort to identify a problem, analyze its causes and determine the best solutions. CNSC staff reviewed the investigation results and corrective actions, and confirmed Orano’s commitment to accident prevention and safety awareness with a focus on safety culture.
Performance
Table 7.3 shows that from 2017 to 2021, Orano’s McClean Lake Operation reported 9 LTIs. There were 3 LTIs reported in 2021. Details on the 2021 LTIs and corrective actions can be found in appendix K.
The TRIR for McClean Lake is included for the last 5 years. The TRIR is the incident frequency rate that measures the number of fatalities, LTIs and other injuries requiring medical treatment.
| 2017 | 2018 | 2019 | 2020 | 2021 | |
|---|---|---|---|---|---|
| Lost-time injuries1 | 0 | 1 | 3 | 2 | 3 |
| Severity rate2 | 67.8 | 4.8 | 48 | 42.8 | 49.8 |
| Frequency rate3 | 0.0 | 0.3 | 0.9 | 0.7 | 0.9 |
| Total recordable incident rate4 | 1.4 | 0.75 | 3.15 | 2.7 | 5.6 |
1 An injury that takes place at work and results in the worker being unable to return to work for a period of time.
2 A measure of the total number of days lost to injury for every 200,000 person-hours worked at the facility.Accident severity rate = [(# of days lost in last 12 months) / (# of hours worked in last 12 months)] x 200,000.
3 A measure of the number of LTIs for every 200,000 person-hours worked at the facility. Accident frequency rate = [(# of injuries in last 12 months) / (# of hours worked in last 12 months)] x 200,000.
4 A measure of the number of fatalities, LTIs and other injuries requiring medical treatment for every 200,000 person-hours worked at the facility. Corrective actions, where necessary, were implemented and the effectiveness was verified and documented by management. CNSC staff verified that Orano strives to involve all levels of its organization in the health and safety program at the McClean Lake Operation. Employees are encouraged and trained to continuously identify and assess risks and propose solutions.
Awareness
CNSC staff observed that the conventional health and safety program at the McClean Lake Operation provided education, training, tools, and support to workers. An active onsite occupational health and safety committee completes regular reviews of the McClean Lake safety program. Through inspections, reviews of incidents, and discussions with McClean Lake staff, CNSC staff verified that the McClean Lake Operation is committed to accident prevention and safety awareness. CNSC staff’s compliance verification activities concluded that the McClean Lake Operation’s health and safety program met regulatory requirements in 2021.
7.5 Additional SCAs
In this 2021 regulatory oversight report, CNSC staff have provided a brief discussion of the additional SCAs; these are presented in the following sections.
7.5.1 Management system
The licensee maintains an integrated management system; this forms part of the licensing basis for the McClean Lake Operation in the LCH.
There were no inspections at the McClean Lake Operation that focused on evaluating the management system SCA in 2021 and no event reports for which this SCA was the main contributory factor.
CNSC staff concluded that the licensee’s program in respect of this SCA remains satisfactory.
7.5.2 Human performance management
The licensee includes program documentation for the human performance management SCA as part of the overall management system documents; these form part of the licensing basis for the McClean Lake Operation in the LCH.
In January 2021, a personnel training–focused inspection was conducted remotely to verify the implementation and effectiveness of Orano’s human performance management at the McClean Lake Operation. The inspection report outlined some deficiencies that resulted in 3 non-compliances related to training documentation and implementation (e.g., out-of-date training documentation, incomplete training change management process, and inconsistent training program evaluations). Orano provided an action plan to address these non-compliances. CNSC staff reviewed the plan and confirmed that Orano had addressed the non-compliances in a timely and satisfactory manner and had taken appropriate corrective actions; therefore, all 3 non-compliances were closed.
There were no event reports for which this SCA was the main contributory factor.
CNSC staff concluded that the licensee’s program in respect of this SCA remains satisfactory.
7.5.3 Operating performance
The licensee includes program documentation for the operating performance SCA as part of the overall management system documents; these form part of the licensing basis for the McClean Lake Operation in the LCH.
There were no inspections at the McClean Lake Operation that focused on evaluating the operating performance SCA in 2021 and no event reports for which this SCA was the main contributory factor.
CNSC staff concluded that the licensee’s program in respect of this SCA remains satisfactory.
7.5.4 Safety analysis
The licensee includes program documentation for the safety analysis SCA as part of the overall management system documents; these form part of the licensing basis for the McClean Lake Operation in the LCH.
There were no inspections at the McClean Lake Operation that focused on evaluating the safety analysis SCA in 2021 and no event reports for which this SCA was the main contributory factor.
CNSC staff concluded that the licensee’s program in respect of this SCA remains satisfactory.
7.5.5 Physical design
The licensee includes program documentation for the physical design SCA as part of the overall management system documents; these form part of the licensing basis for the McClean Lake Operation in the LCH.
There was 1 inspection at the McClean Lake Operation that focused on evaluating the physical design SCA in 2021. There were no event reports for which this SCA was the main contributory factor.
CNSC staff concluded that the licensee’s program in respect of this SCA remains satisfactory.
7.5.6 Fitness for service
The licensee includes program documentation for the fitness for service SCA as part of the overall management system documents; these form part of the licensing basis for the McClean Lake Operation in the LCH.
There were no inspections at the McClean Lake Operation that focused on evaluating the fitness for service SCA and no event reports for which this SCA was the main contributory factor.
CNSC staff concluded that the licensee’s program in respect of this SCA remains satisfactory.
7.5.7 Emergency management and fire protection
The licensee includes program documentation for the emergency management and fire protection SCA as part of the overall management system documents; these form part of the licensing basis for the McClean Lake Operation in the LCH.
There were no inspections at the McClean Lake Operation that focused on evaluating the emergency management and fire protection SCA in 2021 and no event reports for which this SCA was the main contributory factor.
CNSC staff concluded that the licensee’s program in respect of this SCA remains satisfactory.
7.5.8 Waste management
The licensee includes program documentation for the waste management SCA as part of the overall management system documents; these form part of the licensing basis for the McClean Lake Operation in the LCH.
There were no inspections at the McClean Lake Operation that focused on evaluating the waste management SCA in 2021 and no event reports for which this SCA was the main contributory factor.
CNSC staff concluded that the licensee’s program in respect of this SCA remains satisfactory.
7.5.9 Security
The licensee includes program documentation for the security SCA as part of the overall management system documents; these form part of the licensing basis for the McClean Lake Operation in the LCH.
There were no inspections at the McClean Lake Operation that focused on evaluating the security SCA in 2021 and no event reports for which this SCA was the main contributory factor.
CNSC staff concluded that the licensee’s program in respect of this SCA remains satisfactory.
7.5.10 Safeguards and non-proliferation
The licensee includes program documentation for the safeguards and non‑proliferation SCA as part of the overall management system documents; these form part of the licensing basis for the McClean Lake Operation in the LCH.
There were no inspections in 2021 at the McClean Lake Operation that focused on evaluating the safeguards and non-proliferation SCA. There were no notices of non-compliance related to the safeguards and non-proliferation SCA and no event reports for which this SCA was the main contributing factor.
In addition to CNSC compliance activities relating to the specific areas under the safeguards and non-proliferation SCA, the International Atomic Energy Agency (IAEA) conducts independent inspections, with coordination and support provided through the CNSC regulatory framework. No IAEA inspections were conducted at the McClean Lake Operation in 2021.
CNSC staff concluded that the licensee’s program in respect of this SCA remains satisfactory.
7.5.11 Packaging and transport
The licensee includes program documentation for the packaging and transport SCA as part of the overall management system documents; these form part of the licensing basis for the McClean Lake Operation in the LCH.
In October 2021, a focused inspection was conducted remotely to verify the implementation and effectiveness of Orano’s packaging and transport program at the McClean Lake Operation. The inspection report outlined some low-risk deficiencies that resulted in 2 non-compliances related to the packaging and transport documentation (i.e., employee signature missing from the transportation of dangerous goods (TDG) training certificate, and information not presented in the prescribed order). Orano provided an action plan to address these non-compliances. CNSC staff reviewed the plan and confirmed that Orano had addressed the non-compliances and had taken appropriate corrective actions; therefore, both non-compliances were closed.
There were no event reports for which this SCA was the main contributory factor.
CNSC staff concluded that the licensee’s program in respect of this SCA remains satisfactory.
Glossary
For definitions of terms used in this document, see REGDOC-3.6, Glossary of CNSC Terminology, which includes terms and definitions used in the Nuclear Safety and Control Act and the regulations made under it, and in CNSC regulatory documents and other publications. REGDOC-3.6 is provided for reference and information.
A. Facility licensing information
The following tables present CNSC licensing information for the facilities discussed in this report.
| Licensee / site / licence # | Licence effective | Last licence amendment | Licence expiration |
|---|---|---|---|
|
Orano Canada Inc. McClean Lake Operation Uranium mine licencebr UML-MINEMILL-McCLEAN.02/2027 |
July 1, 2017 | January 13, 2022 | June 30, 2027 |
|
Cameco Corporation Cigar Lake Operation Uranium mine licence UML-MINE-CIGAR.00/2031 |
July 1, 2021 | June 28, 2022 | June 30, 2031 |
|
Cameco Corporation Key Lake Operation Uranium mill licence UML-MILL-KEY.01/2023 |
November 1, 2013 | July 29, 2020 | October 31, 2023 |
|
Cameco Corporation Rabbit Lake Operation Uranium mine and mill licence UML-MINEMILL-RABBIT.01/2023 |
November 1, 2013 | March 9, 2021 | October 31, 2023 |
|
Cameco Corporation McArthur River Operation Uranium mine licence UML-MINE-McARTHUR.01/2023 |
November 1, 2013 | June 26, 2019 | October 31, 2023 |
B. List of inspections
The following tables present the CNSC’s inspections by facility and safety control area (SCA) for the facilities discussed in this report.
| Facility | Method | Safety and control area | Notices of non-compliance | Inspection report issued |
|---|---|---|---|---|
|
Cigar Lake
Operation |
Remote | Emergency management and fire protection | 0 | March 26, 2021 |
| Remote |
Operating performance
Fitness for service Radiation protection Conventional health and safety Environmental protection Emergency management and fire protection Waste management Packaging and transport Other public information and disclosure |
2 | March 9, 2021 | |
| Remote | Human performance management | 5 | August 24, 2021 | |
| Remote |
General
Operating performance Environmental protection Radiation protection Conventional health and safety Human performance management Emergency management and fire protection Packaging and transport |
3 | February 17, 2022 | |
| Remote | Fitness for service | 2 | November 25, 2021 | |
| McArthur River Operation | Remote |
Radiation protection
Conventional health and safety Emergency management and fire protection |
1 | November 1, 2021 |
| Remote |
Environmental protection
Radiation protection Conventional health and safety Human performance management |
0 | January 25, 2022 | |
| Rabbit Lake Operation | Remote | General | 0 | August 6, 2021 |
| Remote |
General
Management system Fitness for service Radiation protection Conventional health and safety |
1 | September 28, 2021 | |
| Key Lake Operation | Remote |
General
Management system Physical design Human performance management Security |
0 | May 28, 2021 |
| Remote | Environmental protection | 0 | September 21, 2021 | |
| Remote | General | 0 | January 27, 2022 | |
| McClean Lake Operation | Remote | Human performance management | 3 | February 26, 2021 |
| Remote |
General
Operating performance Safety analysis Physical design Security |
0 | May 26, 2021 | |
| Remote |
General
Management system Operating performance Radiation protection Emergency management and fire protection |
0 | September 20, 2021 | |
| Remote |
General
Management system Operating performance Conventional health and safety Packaging and transport |
0 | November 22, 2021 | |
| Onsite |
Safety analysis
Physical design Waste management |
0 | October 5, 2021 | |
| Remote | Packaging and transport | 2 | December 10, 2021 |
C. Safety and control area definitions
The CNSC evaluates how well licensees meet regulatory requirements and CNSC performance expectations for programs in 14 safety and control areas (SCAs). The SCAs are grouped into 3 functional areas: management, facility and equipment, and core control processes.
| Safety and Control Area Framework | |||
|---|---|---|---|
| Functional area | Safety and control area | Definition | Specific areas |
| Management | Management system | Covers the framework that establishes the processes and programs required to ensure an organization achieves its safety objectives, continuously monitors its performance against these objectives, and fosters a healthy safety culture. |
Management system
Organization Performance assessment, improvement and management review Operating experience (OPEX) Change management Safety culture Configuration management Records management Management of contractors Business continuity |
| Human performance management | Covers activities that enable effective human performance through the development and implementation of processes that ensure a sufficient number of licensee personnel are in all relevant job areas and have the necessary knowledge, skills, procedures and tools in place to safely carry out their duties. |
Human performance program
Personnel training Personnel certification Work organization and job design Fitness for duty |
|
| Operating performance | Includes an overall review of the conduct of the licensed activities and the activities that enable effective performance. |
Conduct of licensed activity
Procedures Reporting and trending Outage management performance Safe operating envelope Severe accident management and recovery Accident management and recovery |
|
| Facility and equipment | Safety analysis | Covers maintenance of the safety analysis that supports the overall safety case for the facility. Safety analysis is a systematic evaluation of the potential hazards associated with the conduct of a proposed activity or facility and considers the effectiveness of preventative measures and strategies in reducing the effects of such hazards. |
Deterministic safety analysis
Hazard analysis Probabilistic safety analysis Criticality safety Severe accident analysis Management of safety issues (including R&D programs) |
| Physical design | Relates to activities that impact the ability of structures, systems and components to meet and maintain their design basis given new information arising over time and taking changes in the external environment into account. |
Design governance
Site characterization Facility design Structure design System design Component design |
|
| Fitness for service | Covers activities that impact the physical condition of structures, systems and components to ensure that they remain effective over time. This area includes programs that ensure all equipment is available to perform its intended design function when called upon to do so. |
Equipment fitness for service / equipment performance
Maintenance Structural integrity Aging management Chemistry control Periodic inspection and testing |
|
| Core control processes | Radiation protection | Covers the implementation of a radiation protection program in accordance with the Radiation Protection Regulations. The program must ensure that contamination levels and radiation doses received by individuals are monitored, controlled and maintained ALARA. |
Application of ALARA
Worker dose control Radiation protection program performance Radiological hazard control |
| Conventional health and safety | Covers the implementation of a program to manage workplace safety hazards and to protect workers. |
Performance
Practices Awareness |
|
| Environmental protection | Covers programs that identify, control and monitor all releases of radioactive and hazardous substances and effects on the environment from facilities or as the result of licensed activities. |
Effluent and emissions control (releases)
Environmental management system Assessment and monitoring Protection of people Estimated dose to public Environmental risk assessment |
|
| Emergency management and fire protection | Covers emergency plans and emergency preparedness programs that exist for emergencies and for non-routine conditions. This area also includes any results of participation in exercises. |
Conventional emergency preparedness and response
Nuclear emergency preparedness and response Fire emergency preparedness and response |
|
| Waste management | Covers internal waste-related programs that form part of the facility’s operations up to the point where the waste is removed from the facility to a separate waste management facility. This area also covers the planning for decommissioning. |
Waste characterization
Waste minimization Waste management practices Decommissioning plans |
|
| Security | Covers the programs required to implement and support the security requirements stipulated in the regulations, the licence, orders, or expectations for the facility or activity. |
Facilities and equipment
Response arrangements Security practices Drills and exercises |
|
| Safeguards and non-proliferation | Covers the programs and activities required for the successful implementation of the obligations arising from the Canada / International Atomic Energy Agency (IAEA) safeguards agreements, as well as all other measures arising from the Treaty on the Non-Proliferation of Nuclear Weapons. |
Nuclear material accountancy and control
Access and assistance to the IAEA Operational and design information Safeguards equipment, containment and surveillance Import and export |
|
| Packaging and transport | Covers programs for the safe packaging and transport of nuclear substances to and from the licensed facility. |
Package design and maintenance
Packaging and transport Registration for use |
|
| Other matters of regulatory interest | |||
|
Environmental assessment
CNSC consultation – Indigenous CNSC consultation – other Cost recovery Financial guarantees Improvement plans and significant future activities Licensee public information program Nuclear liability insurance |
|||
D. Safety performance rating methodology
The performance ratings used in this report are defined as follows:
Satisfactory (SA)
Safety and control measures implemented by the licensee are sufficiently effective. In addition, compliance with regulatory requirements is satisfactory. Compliance within the safety and control area or specific area meets requirements and CNSC expectations. Any deviation is minor, and any issues are considered to pose a low risk to the achievement of regulatory objectives and CNSC expectations. Appropriate improvements are planned.
Below expectations (BE)
Safety and control measures implemented by the licensee are marginally ineffective. In addition, compliance with regulatory requirements falls below expectations. Compliance within the safety and control area or specific area deviates from requirements or CNSC expectations to the extent that there is a moderate risk of ultimate failure to comply. Improvements are required to address identified weaknesses. The licensee is taking appropriate corrective action.
Unacceptable (UA)
Safety and control measures implemented by the licensee are significantly ineffective. In addition, compliance with regulatory requirements is unacceptable and is seriously compromised. Compliance within the safety and control area is significantly below requirements or CNSC expectations, or there is evidence of overall non-compliance. Without corrective action, there is a high probability that the deficiencies will lead to unreasonable risk. Issues are not being addressed effectively, no appropriate corrective measures have been taken, and no alternative plan of action has been provided. Immediate action is required.
The following rating is no longer used by the CNSC. It is defined below for informational purposes only. This rating may appear in historic data.
Fully satisfactory (FS)
Safety and control measures implemented by the licensee are highly effective. In addition, compliance with regulatory requirements is fully satisfactory and compliance within the safety and control area or specific area exceeds requirements and CNSC expectations. Overall, compliance is stable or improving, and any problems or issues that arise are promptly addressed.
E. Safety and control area ratings
| Safety and control area | 2017 | 2018 | 2019 | 2020 | 2021 |
| Management system | SA | SA | SA | SA | SA |
| Human performance management | SA | SA | SA | SA | SA |
| Operating performance | SA | SA | SA | SA | SA |
| Safety analysis | SA | SA | SA | SA | SA |
| Physical design | SA | SA | SA | SA | SA |
| Fitness for service | SA | SA | SA | SA | SA |
| Radiation protection | SA | SA | SA | SA | SA |
| Conventional health and safety | SA | SA | SA | SA | SA |
| Environmental protection | SA | SA | SA | SA | SA |
| Emergency management and fire protection | SA | SA | SA | SA | SA |
| Waste management | SA | SA | SA | SA | SA |
| Security | SA | SA | SA | SA | SA |
| Safeguards and non-proliferation | SA | SA | SA | SA | SA |
| Packaging and transport | SA | SA | SA | SA | SA |
| Safety and control area | 2017 | 2018 | 2019 | 2020 | 2021 |
|---|---|---|---|---|---|
| Management system | SA | SA | SA | SA | SA |
| Human performance management | SA | SA | SA | SA | SA |
| Operating performance | SA | SA | SA | SA | SA |
| Safety analysis | SA | SA | SA | SA | SA |
| Physical design | SA | SA | SA | SA | SA |
| Fitness for service | SA | SA | SA | SA | SA |
| Radiation protection | SA | SA | SA | SA | class SA |
| Conventional health and safety | SA | SA | SA | SA | SA |
| Environmental protection | SA | SA | SA | SA | SA |
| Emergency management and fire protection | SA | SA | SA | SA | SA |
| Waste management | SA | SA | SA | SA | SA |
| Security | SA | SA | SA | SA | SA |
| Safeguards and non-proliferation | SA | SA | SA | SA | SA |
| Packaging and transport | SA | SA | SA | SA | SA |
| Safety and control area | 2017 | 2018 | 2019 | 2020 | 2021 |
|---|---|---|---|---|---|
| Management system | SA | SA | SA | SA | SA |
| Human performance management | SA | SA | SA | SA | SA |
| Operating performance | SA | SA | SA | SA | SA |
| Safety analysis | SA | SA | SA | SA | SA |
| Physical design | SA | SA | SA | SA | SA |
| Fitness for service | SA | SA | SA | SA | SA |
| Radiation protection | SA | SA | SA | SA | SA |
| Conventional health and safety | SA | SA | SA | SA | SA |
| Environmental protection | SA | SA | SA | SA | SA |
| Emergency management and fire protection | SA | SA | SA | SA | SA |
| Waste management | SA | SA | SA | SA | SA |
| Security | SA | SA | SA | SA | SA |
| Safeguards and non-proliferation | SA | SA | SA | SA | SA |
| Packaging and transport | SA | SA | SA | SA | SA |
| Safety and control area | 2017 | 2018 | 2019 | 2020 | 2021 |
|---|---|---|---|---|---|
| Management system | SA | SA | SA | SA | SA |
| Human performance management | SA | SA | SA | SA | SA |
| Operating performance | SA | SA | SA | SA | SA |
| Safety analysis | SA | SA | SA | SA | SA |
| Physical design | SA | SA | SA | SA | SA |
| Fitness for service | SA | SA | SA | SA | SA |
| Radiation protection | FS | FS | SA | SA | SA |
| Conventional health and safety | SA | SA | SA | SA | SA |
| Environmental protection | SA | SA | SA | SA | SA |
| Emergency management and fire protection | SA | SA | SA | SA | SA |
| Waste management | SA | SA | SA | SA | SA |
| Security | SA | SA | SA | SA | SA |
| Safeguards and non-proliferation | SA | SA | SA | SA | SA |
| Packaging and transport | SA | SA | SA | SA | SA |
| Safety and control area | 2017 | 2018 | 2019 | 2020 | 2021 |
|---|---|---|---|---|---|
| Management system | SA | SA | SA | SA | SA |
| Human performance management | SA | SA | SA | SA | SA |
| Operating performance | SA | SA | SA | SA | SA |
| Safety analysis | SA | SA | SA | SA | SA |
| Physical design | SA | SA | SA | SA | SA |
| Fitness for service | SA | SA | SA | SA | SA |
| Radiation protection | SA | SA | SA | SA | SA |
| Conventional health and safety | SA | SA | SA | SA | SA |
| Environmental protection | SA | SA | SA | SA | SA |
| Emergency management and fire protection | SA | SA | SA | SA | SA |
| Waste management | SA | SA | SA | SA | SA |
| Security | SA | SA | SA | SA | SA |
| Safeguards and non-proliferation | SA | SA | SA | SA | SA |
| Packaging and transport | SA | SA | SA | SA | SA |
F. Financial guarantees
The following tables outline the financial guarantees, as of December 31, 2021, for the uranium mine and mill sites discussed in this report.
| Facility | Canadian dollar amount |
|---|---|
| Cigar Lake Operation | $61,790,000 |
| McArthur River Operation | $42,100,000 |
| Rabbit Lake Operation | $202,700,000 |
| Key Lake Operation | $222,500,000 |
| McClean Lake Operation | $107,241,000 |
| Total | $636,331,000 |
G. Worker dose data
Table G-1 shows the total number of nuclear energy workers (NEWs) monitored at each of the 5 uranium mines and mills for 2021. Individuals who are required to work with a nuclear substance or in a nuclear industry are designated as NEWs if they have a reasonable probability of receiving an individual effective dose greater than the prescribed effective dose limit for a member of the public (i.e., 1 millisievert [mSv] in a calendar year).
| Cigar Lake | McArthur River | Rabbit Lake | Key Lake | McClean Lake | |
|---|---|---|---|---|---|
| Total NEWs | 1,047 | 333 | 163 | 676 | 353 |
Table G-2 compares the average and maximum individual effective doses for the 5 operating uranium mines and mills.
| Facility | Average individual effective dose (mSv/year) | Maximum individual effective dose (mSv/year) | Regulatory limit |
|---|---|---|---|
| Cigar Lake Operation | 0.32 | 6.03 | 50 mSv/year |
| McArthur River Operation | 0.25 | 3.06 | |
| Rabbit Lake Operation | 0.57 | 2.47 | |
| Key Lake Operation | 0.52 | 3.13 | |
| McClean Lake Operation | 0.79 | 4.89 |
Tables G-3 to G-7 show the 5-year trend (from 2017 to 2021) for the average and maximum effective annual doses to NEWs at the 5 uranium mines and mills. No radiation dose at any facility exceeded the regulatory effective dose limit in 2021. Each of these tables also identifies the maximum 5-year dose to an individual NEW at each uranium mine and mill for the years 2021–25.
| Dose data | 2017 | 2018 | 2019 | 2020 | 2021 | Regulatory limit |
|---|---|---|---|---|---|---|
| Total NEWs | 1,107 | 824 | 875 | 861 | 1,047 | N/A |
| Average individual effective dose (mSv) | 0.34 | 0.47 | 0.57 | 0.38 | 0.32 | N/A |
| Maximum individual effective dose (mSv) | 3.36 | 7.28 | 3.70 | 2.82 | 6.03 | 50 mSv/year |
| Maximum dose for an individual in current 5-year period (mSv) 2021–25 | 6.03 | 100 mSv/5-year dosimetry period | ||||
| Dose data | 2017 | 2018 | 2019 | 2020 | 2021 | Regulatory limit |
|---|---|---|---|---|---|---|
| Total NEWs | 958 | 595 | 136 | 172 | 333 | N/A |
| Average individual effective dose (mSv) | 0.79 | 0.15 | 0.33 | 0.27 | 0.25 | N/A |
| Maximum individual effective dose (mSv) | 5.73 | 2.67 | 2.82 | 2.94 | 3.06 | 50 mSv/year |
| Maximum dose for an individual in current 5-year period (mSv) 2021–25 | 3.06 | 100 mSv/5-year dosimetry period | ||||
| Dose data | 2017 | 2018 | 2019 | 2020 | 2021 | Regulatory limit |
|---|---|---|---|---|---|---|
| Total NEWs | 153 | 166 | 119 | 128 | 163 | N/A |
| Average individual effective dose (mSv) | 0.4 | 0.46 | 0.75 | 0.70 | 0.57 | N/A |
| Maximum individual effective dose (mSv) | 1.56 | 1.7 | 2.73 | 2.93 | 2.47 | 50 mSv/year |
| Maximum dose for an individual in current 5-year period (mSv) 2021–25 | 2.47 | 100 mSv/5-year dosimetry period | ||||
Table G-6: Radiation dose data for NEWs, Key Lake Operation, 2017–21
| Dose data | 2017 | 2018 | 2019 | 2020 | 2021 | Regulatory limit |
|---|---|---|---|---|---|---|
| Total NEWs | 684 | 481 | 260 | 302 | 676 | N/A |
| Average individual effective dose (mSv) | 0.66 | 0.19 | 0.27 | 0.35 | 0.52 | N/A |
| Maximum individual effective dose (mSv) | 5.39 | 2.02 | 1.64 | 2.11 | 3.13 | 50 mSv/year |
| Maximum dose for an individual in current 5-year period (mSv) 2021–25 | 3.13 | 100 mSv/5-year dosimetry period | ||||
| Dose data | 2017 | 2018 | 2019 | 2020 | 2021 | Regulatory limit |
|---|---|---|---|---|---|---|
| Total NEWs | 334 | 330 | 323 | 369 | 353 | N/A |
| Average individual effective dose (mSv) | 0.91 | 0.90 | 0.93 | 0.67 | 0.79 | N/A |
| Maximum individual effective dose (mSv) | 5.12 | 5.50 | 4.70 | 4.28 | 4.89 | 50 mSv/year |
| Maximum dose for an individual in current 5-year period (mSv) 2021–25 | 4.89 | 100 mSv/5-year dosimetry period | ||||
H. Radiological action level exceedances reported to the CNSC
CNSC staff reviewed and were satisfied with the remedial actions taken by the licensees for the radiological action level exceedances reported in table H-1. Table H-1 notes the details of each event, the corrective actions taken by the licensee, and the CNSC’s associated significance ratings. Table H-2 lists the rating definitions and gives examples of safety significance across fuel cycle facilities.
| Facility | Action level exceedance | Corrective action | Significance rating |
|---|---|---|---|
| Cigar Lake Operation |
In November, notification was received from the dosimetry provider of an elevated personal alpha dosimeter level for September, specifically an exposure of 4.28 mSv for radon progeny for a JBS operator.
The investigation identified that the unexpected exposure likely occurred during non-routine work activities, when the individual was assisting in preparing the underground clarifier for entry by workers to conduct inspections and repairs. |
The investigation for this event resulted in the following corrective actions: the installation of additional negative ventilation when the clarifier is drained of water, the installation of a permanent prism location adjacent to the upper clarifier area, and the implementation of radiation work permit requirements when working around the clarifier lid openings when drained. CNSC staff reviewed and accepted the submitted corrective actions. Corrective actions will be verified through onsite verification activities during regular inspections. | Medium |
| McArthur River Operation | None reported | N/A | N/A |
| Rabbit Lake Operation | None reported | N/A | N/A |
| Key Lake Operation | None reported | N/A | N/A |
| McClean Lake Operation | None reported | N/A | N/A |
| Radiation protection | ||
|---|---|---|
| Safetysignificance | Definition | Fuel cycle facility-specific examples |
| High |
Exposures to multiple workers in excess of regulatory limits.
Widespread contamination to several persons or to a place. |
Incident that results in, or has reasonable potential for, a worker to exceed regulatory limits.
Examples:
|
| Medium |
Exposure to a worker in excess of regulatory limits.
An incident that would result in a licensee exceeding action level. Limited contamination that could affect a few persons or a limited area. |
Incident that results in or has reasonable potential to exceed an action level.
Example:
|
| Low |
Increased dose below reportable limits.
Contamination that could affect a worker. |
Incident that results in, or has reasonable potential to exceed, the highest administrative level. |
I. Reportable releases to the environment (spills)
Canadian Nuclear Safety Commission (CNSC) staff reviewed and were satisfied with the remedial actions taken by the licensees in response to the spills presented in table I-1 and concluded that these spills resulted in no residual impacts to the environment. Table I-1 notes the details of each spill, the corrective actions taken by the licensee, and the CNSC’s spill significance ratings. Table I-2 lists the spill rating definitions and gives examples of safety significance across fuel cycle facilities.
| Facility | Details | Corrective action | Significance rating |
|---|---|---|---|
| Cigar Lake Operation | On January 1, 2021, maintenance was being performed on generator 7 in the powerhouse building. As part of the work, antifreeze (ethylene glycol) was removed from the generator and pumped to a holding tank and later re-added back to generator 7. During the refilling, a valve leading to the radiator on generator 2 was open (not part of current work), causing antifreeze to enter generator 2’s radiator and overflow through the radiator cap. Approximately 100 litres of antifreeze reported to a concrete pad under the radiators and to the surrounding frozen soil. | Antifreeze and snow from the area were removed and put into containers for appropriate disposal. All filling valves were locked in the closed position after the event, and instructions are to be added to the valves for proper filling. | Low |
| Cigar Lake Operation | On May 17, 2021, while walking to work, a worker noticed the smell of propane when walking past Dry #3. A gasfitter was engaged to investigate and isolate the source of the propane leak. It was identified that the line feeding propane to the building had sagged when the fasteners securing the line to the building had become loose, causing the leak. The leak was greater than 10 minutes in duration, classifying the incident as a reportable discharge. | The line was isolated and repaired. The safety department conducted air quality checks in the area to ensure a safe environment. | Low |
| Cigar Lake Operation | On December 15, 2021, at 14:45, while clearing snow around the condensers at the surface modular freeze plant, an employee noticed an ammonia odour. After investigating, it was identified that the fire valve was bypassing ammonia and venting it from the stack. It is estimated that approximately 400 lbs of ammonia gas bypassed and vented from the relief stack. | The valve seat was tightened, returning it to its normal condition. | Low |
| Cigar Lake Operation | On December 18, 2021, at 19:40, while clearing snow on the East Freeze Pad, a loader operator struck the brine supply hose to a freeze hole, shearing the hose from the wellhead. It is estimated that approximately 17,000 litres of brine reported to the ground. The snow impeded the operator's ability to immediately identify that the hose had been compromised. Freeze plant operating staff subsequently identified the leak as a result of the loss of brine in the system. | The freeze system was shut down and the line was isolated. The brine and affected snow were collected for proper disposal. | Low |
| McArthur River Operation | No reportable discharges, recordable releases or reportable incidents | N/A | N/A |
| Rabbit Lake Operation | On May 11, 2021, a breach in the B‑Zone ore pad drainage ditch resulted in the release of an estimated 10.3 m3 of spring melt water from the perimeter ditch of the ore pad onto the perimeter road and into the surrounding area. | The eroded section was rebuilt, a vacuum truck was dispatched to remove water from the ditch to draw down the elevated water level, and a pump was placed at the culvert location to transfer water from upgradient to downgradient of the culvert while the culvert was cleared. Impacted soil and roadbed material were removed, and a follow-up gamma survey was conducted, which verified that impacted material had been effectively removed. The licensee recommended including additional inspections to monitor the berm and assess stability. | Low |
| Rabbit Lake Operation | On May 26, 2021, at the Warehouse Pad 3 Laydown Area, it was discovered that a tote of new engine oil had a cracked drain valve, which had caused a leak of approximately 1.2 m3 of new oil. |
The licensee established an earthen berm around the perimeter of the area of downgradient water ponding to prevent any further migration of the released material. Both a vacuum truck and spill pads were deployed to recover as much oil mixed with melted water as possible. Oil was identified at a low point (trench) and recovery in this area involved the use of clean water to flush the oil along and then recovered using the vacuum truck. The area was backfilled after clean-up activities to reduce erosion concerns. The remaining hazardous materials, which were stored outside, were moved to an area with approved secondary containment. |
Low |
| Rabbit Lake Operation | On May 28, 2021, a separation in the barge line at a fused butt weld at the AGTMF North Pond Surface Water caused a release of an estimated 2.75 m3 of melt water. | Clean-up activities were completed, and contaminated soil was excavated. Follow‑up scanning confirmed that the release area remained similar to background conditions, and backfill with clean material was completed. | Low |
| Rabbit Lake Operation | On August 25, 2021, at the Eagle Point Sand Dryer, there was a release of approximately 583 kg of propane. | Upon discovery, the licensee’s Emergency Response Team (ERT) was dispatched, the area was evacuated, and roadblocks were established to restrict access to the area. The power was shut down to the propane pump and the main propane supply valve was closed, stopping the flow of propane from the tank to the pump. The leaking section of piping was then isolated, thereby stopping further release and the remaining propane was allowed to disperse. The licensee’s investigation into this event identified that a failure of the pressure gauge was the cause of the release. A number of corrective actions were identified and assigned, including replacement of the gauge with a higher quality substitute. | Low |
| Key Lake Operation | On February 12, 2021, approximately 3,000 litres of contaminated water was released from a valve shack adjacent to the Deilmann Tailings Management Facility to the ground. A split in a 3-inch pipe occurred as a result of the extreme cold temperatures. |
The contaminated water was moved, using a vacuum truck, to the above-ground tailings management facility.
Additional foam insulation will be used to create a better seal within the valve shelter around the lateral connection. The 3-inch elbow was insulated to increase the efficacy of the heat tape. |
Low |
| Key Lake Operation | On June 22, 2021, Cameco notified CNSC staff of the discovery of elevated concentrations of constituents of potential concern (COPCs), specifically ammonia and sulfate. The COPCs were observed in groundwater samples from monitoring wells MT-19-01 and MT-19-12, taken in the 2020 and 2021 sampling program for these wells. The wells were installed as part of the site assessment resulting from the 2018 reportable discharge from the molybdenum plant (refer to CMD 19-M13 Footnote 13 and CMD 19-M36 Footnote 14). It was deemed likely that a release to the environment occurred before Key Lake went into a state of care and maintenance in 2018 and that the elevated concentrations were not solely the result of previously reported historical discharges or discoveries at Key Lake. | Cameco submitted an assessment report in May 2022 and will be submitting a corrective action plan in fall 2022. | Low |
| Key Lake Operation | On September 13, 2021, an unknown quantity of propane was released from a leak on the propane line outside the leaching building at the mill. A mill operator reported the smell of propane while conducting inspection/rounds. The insultation cover on propane piping had deteriorated and corrosion had developed on a pipe, which eventually led to the leak. | The valve was closed and the line was isolated. The area was flagged off. Maintenance personnel tested the line and determined that most of the line thickness was close to original specification, with varying thickness along the length of pipe. The corroded section of the pipe was replaced. Maintenance personnel will investigate the option of replacing the full length of pipe that runs along the building with corrosion resistant piping and will then insulate the line if necessary. | Low |
| Key Lake Operation | On December 27, 2021, over 60 litres of propane was released from the propane storage area near the steam plant. A pressure gauge on the pipe near the propane pump broke, resulting in the release. The powerhouse operator was alerted by an alarm and responded. | Maintenance was contacted to isolate the pump, and the area was barricaded with red safety tape until the repairs could be completed. | Low |
| McClean Lake Operation | On January 29, 2021, approximately 1 m3 of T-Amine 950 reagent was released to the environment while a pallet was being moved. |
The totes of hazardous materials were moved from the loading pad into a Sea-can to prevent snow accumulation and provide clear access. In addition, a requirement to move totes during daylight hours to ensure adequate visibility was implemented. |
Low |
| McClean Lake Operation | On June 9, 2021, approximately 150 m3 of partially treated Sue C pit water was released to the environment because of a hole in the pond liner. | The water was removed from under the liner with a vacuum truck and returned into the Sue C pit. The hole was repaired. | Low |
| McClean Lake Operation | On October 9, 2021, based on density, approximately 232 kg of tailings solids were released to the environment because the tailings underflow pipeline failed at a valve. | The slurry was cleaned up with a vacuum truck and placed back into the tailings circuit. The affected ground was cleaned up and taken to the JEB Ore Pad for disposal. | Low |
| McClean Lake Operation | On November 23, 2021, approximately 10 m3 of reclaim water was released to the environment due to a failed pump rupture disc at the JEB TMF. | The reclaim flow was shut off and the reclaim water removed from the pumphouse. Work instructions and training materials for restarting the reclaim pump were updated and reviewed with all operators. | Low |
| McClean Lake Operation | On December 1, 2021, the calciner scrubber was restarted after routine cleaning of the scrubber ducting. Material had loosened during the cleaning process and was discharged from the calciner stack. Approximately 0.7 m3 of material was discharged, which settled to the mill terrace in the immediate vicinity of the calciner building. | The material was cleaned up and moved onto the ore pad. The work instruction for restarting the calciner scrubber was revised to state that the solution flow to the scrubber is to be activated prior to starting the scrubber fan. | Low |
| Environmental protection | ||
|---|---|---|
| Safety significance | Definition | Fuel cycle facility-specific examples |
| High | Nuclear or hazardous substances being released to the environment exceeding regulatory limits (including public exposure) or that results in significant impact to the environment. |
Incident that results in, or has reasonable potential to have, a significant or moderate impact or extensive future remediation.
Examples:
|
| Medium | Nuclear or hazardous substances being released to the environment exceeding action levels (including public exposure) or that result in impact to the environment outside the licensing basis. |
Incident that results in, or has reasonable potential to have, a minor impact or that requires some future remediation.
Examples:
|
| Low | Release of hazardous or nuclear substances to the environment below regulatory limits. |
Incident that results in, or has reasonable potential to have, a negligible impact.
Examples:
|
J. Environmental action level and regulatory limit exceedances reported to the CNSC
Canadian Nuclear Safety Commission (CNSC) staff reviewed and were satisfied with the corrective actions taken by the licensees for the environmental action level and regulatory exceedances reported in table J-1. Table J-1 notes the details of each event, the corrective actions taken by licensees, and the CNSC’s associated significance ratings. Table J-2 lists the rating definitions and gives examples of safety significance across fuel cycle facilities.
| Facility | Action level or regulatory limit exceedance | Corrective action | Significance rating |
|---|---|---|---|
| Cigar Lake Operation | None | N/A | N/A |
| McArthur River Operation | None | N/A | N/A |
| Rabbit Lake Operation | None | N/A | N/A |
| Key Lake Operation | None | N/A | N/A |
| McClean Lake Operation | On June 1, 2021, Orano reported that a TSS concentration above the action level was measured in the JEB WTP 24-hour discharge composite sample from May 31. | An investigation attributed the result to sample contamination and determined that it was not representative of the discharge. A follow-up report was submitted. | Medium |
| Environmental protection | ||
|---|---|---|
| Safety significance | Definition | Fuel cycle facility-specific examples |
| High | Nuclear or hazardous substances being released to the environment exceeding regulatory limits (including public exposure) or that results in significant impact to the environment. |
Incident that results in, or has reasonable potential to have, a significant or moderate impact or extensive future remediation.
Examples:
|
| Medium | Nuclear or hazardous substances being released to the environment exceeding action levels (including public exposure) or that result in impact to the environment outside the licensing basis. |
Incident that results in, or has reasonable potential to have, a minor impact or that requires some future remediation.
Examples:
|
| Low | Release of hazardous or nuclear substances to the environment below regulatory limits. |
Incident that results in, or has reasonable potential to have, a negligible impact.
Examples: effluent administrative level-exceedance spills to environment (including atmosphere) with no future impacts |
K. Lost-time injuries
A lost-time injury (LTI) is a workplace injury that results in the worker being unable to return to work for a period of time. Table K-1 outlines the LTIs reported in the 2021 reporting period at the 5 operating uranium mines and mills. Table K-2 lists the rating definitions.
| Facility | Incident | Corrective action | Significance rating |
|---|---|---|---|
|
Cigar Lake Operation |
A worker reported back pain after attempting to close a garbage truck back door that was not closing properly. The worker was placed on restricted work for the remainder of their shift. | N/A | Medium |
| Cigar Lake Operation | A worker misplaced their footing and fell while stepping down from equipment. While attempting to stop their fall, the worker injured their wrist. | N/A | Medium |
| McArthur River Operation | None | N/A | N/A |
| Rabbit Lake Operation | None | N/A | N/A |
|
Key Lake Operation |
None | N/A | N/A |
| McClean Lake Operation | July 24, 2021 – A long-term contractor pulled their chest muscles while moving a heavy dock plate to unload a food truck at the kitchen loading dock. | Orano requires workers to work together to lift heavier objects. The procedure stated that 2 persons are to move the deck plate into place, but was specific to kitchen workers. The transport workers were made aware of the lifting requirement. Signage was installed as a reminder that 2 persons are required to move the dock plate. | Medium |
| McClean Lake Operation | September 9, 2021 – A worker was walking down an incline at the TMF and felt knee pain. The worker was sent offsite for assessment, which resulted in lost time. | All workers were encouraged to participate in pre-work stretches. This takes place in the morning in addition to as and when the worker feels it necessary. | Medium |
| McClean Lake Operation | October 29, 2021 – A worker caught their thumb between a cog and the chain on an overhead door. The worker received treatment offsite for the injury. | Limit stops were to be placed on the overhead door in question, and a search was begun for a better tool to do the job. | Medium |
| Safety significance | Definition |
|---|---|
| High | Fatality or serious injury |
| Medium | Serious injury or lost-time accident |
| Low | Minor injury |
L. Annual releases of radionuclides to the environment
Introduction
Operating uranium mines and mills in northern Saskatchewan have process waters, which require capture, treatment and release through a final point of control. This appendix presents the total annual release of relevant radionuclides from these facilities between 2017 and 2021.
Releases of total uranium are reported as kilograms (kg), while releases of uranium-238 progeny are reported in megabecquerels (MBq).
CNSC staff have begun publishing annual releases of radionuclides to the environment from nuclear facilities on the CNSC Open Government portal.
Liquid releases to surface waters
The uranium mines and mills in northern Saskatchewan have process waters requiring interception, collection and treatment prior to release. Total uranium and a number of uranium-238 progeny are monitored at the operating uranium mines and mills. CNSC staff publish annual releases of radionuclides to the environment from nuclear facilities on the CNSC Open Government portal.
M. Links to websites
Province of Saskatchewan – Benefits from Northern Mining
Cameco Corporation – Cigar Lake Operation
Cameco Corporation – McArthur River / Key Lake Operations
Cameco Corporation – Rabbit Lake Operation
CNSC Fact Sheet – Natural Background Radiation
CNSC Independent Environmental Monitoring Program
Eastern Athabasca Regional Monitoring Program
Health Canada’s Guidelines for Canadian Drinking Water Quality
National Pollutant Release Inventory
Northern Saskatchewan Environmental Quality Committee
Saskatchewan Environmental Quality Guidelines
N. List of Indigenous Nations and communities
List of Indigenous Nations and communities whose traditional and/or treaty territories are in proximity to the sites covered by this report:
Athabasca Chipewyan First Nation
Birch Narrows Dene Nation
Black Lake First Nation
Buffalo River Dene Nation
Camsell Portage
Clearwater River Dene Nation
English River First Nation
Fond du Lac First Nation
Hatchet Lake First Nation
Lac La Ronge Indian Band
Métis Nation-Saskatchewan
Pinehouse Kineepik Métis
Prince Albert Grand Council
Stony Rapids
Uranium City
Wollaston Lake
O. Acronyms
ALARA - as low as reasonably achievable
AREVA - AREVA Resources Canada Inc. (now Orano Canada Inc.)
BE - below expectations
Bq/L - becquerels per litre
Bq/m3 - becquerels per cubic metre
Cameco - Cameco Corporation
CMD - Commission member document
CNSC - Canadian Nuclear Safety Commission
COPC - constituent of potential concern
EARMP - Eastern Athabasca Regional Monitoring Program
ECCC - Environment and Climate Change Canada
EPR - environmental protection report
ERA - environmental risk assessment
FS - fully satisfactory
HHRA - human health risk assessment
IAEA - International Atomic Energy Agency
ICRP - International Commission on Radiological Protection
IEMP - Independent Environmental Monitoring Program
JEB - John Everett Bates
kg - kilogram
LCH - licence conditions handbook
LLRD - Long-lived Radioactive Dust
LTI - lost-time injury
mASL - metres above sea level
MBq - megabecquerel
MDMER - Metal and Diamond Mining Effluent Regulations
mg/L - milligrams per litre
Mkg - million kilograms
mSv - millisievert
mSv/hr - macrosievert per hour
NEW - nuclear energy worker
NSCA - Nuclear Safety and Control Act
NPRI - National Pollutant Release Inventory
Orano - Orano Canada Inc.
p-mSv - person-millisieverts
PAD - personal alpha dosimeter
PFP - Participant Funding Program
REGDOC - Regulatory Document
RnG - radon gas
RnP - radon progeny
SA - satisfactory
SCA - safety and control area
SO2 - sulphur dioxide
SRC - Saskatchewan Research Council
TID-EP - Technical Information Document – Environmental Performance
TMF - tailings management facility
TRIR - total recordable incident rate
TSP - total suspended particulate
TSS - total suspended solids
U - uranium
UA - unacceptable
WTP - water treatment plant
Page details
- Date modified: